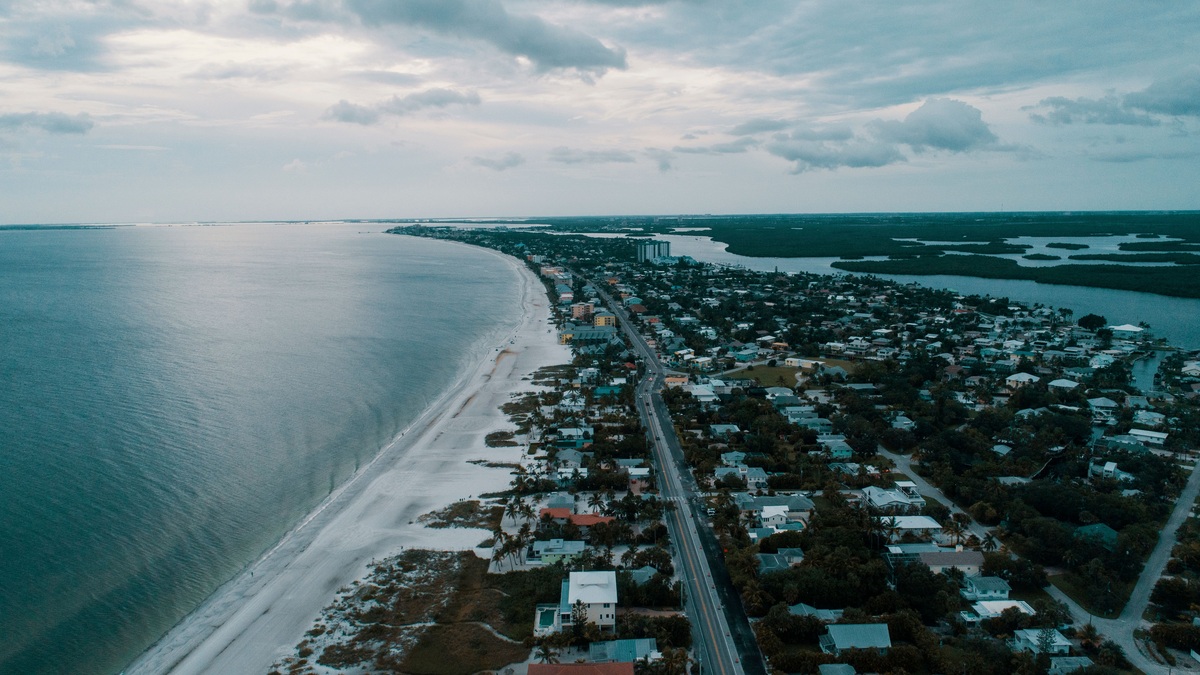
About 40 percent of the U.S. population lives in coastal counties, even though those counties occupy less than one tenth of the land in the contiguous states. Depending on the year and the precise definition of “coastal,” the total is roughly 120 million to 127 million people.
NOAA’s widely cited answer says 127 million Americans live in coastal counties. A Census Bureau analysis using 2020 data gives approximately 120 million, also equal to 40 percent. The difference is a reminder to check the date and geographic definition behind any coastal-population figure.
What counts as living near the coast
“Near the coast” has no single universal boundary. One common measure counts counties that border the Atlantic, Pacific or Gulf coast, including estuaries. NOAA calls these coastal shoreline counties. The definition captures places directly exposed to coastal processes, but a county can extend far inland.
A broader coastal-watershed definition includes counties connected to the coast through rivers and drainage basins. It describes a larger population whose activities can influence coastal water, although many residents may live beyond sight of the sea. Researchers choose between the definitions according to the question they are asking.
County-level statistics are practical because population and economic data are published consistently for counties. They are less precise than measuring every home’s distance from the shoreline. The 40 percent figure should be read as a national planning benchmark rather than a count of people living on the beachfront.
The 40 percent estimate
A U.S. Census Bureau study reports that approximately 120 million people lived on the coast in 2020. Coastal areas accounted for 53 percent of national employment that year. Those numbers show why storms and sea-level changes can affect the wider economy as well as households beside the water.
NOAA’s 127 million estimate comes from a different data vintage and presentation. Both sources round their results, while county populations change every year. A gap of several million does not reverse the central finding: roughly two in five Americans live in counties closely connected to an ocean coast.
Why coastal counties are so crowded
Ports drew settlements because water offered access to trade. Many of those settlements developed into major metropolitan regions with dense transportation networks and large labor markets. Tourism and military facilities added other economic anchors in particular places.
The coast also provides amenities that people value, from beaches to cooler maritime climates. Retirees and remote workers have supported growth in some smaller communities. Local patterns vary sharply, since parts of Alaska and the Pacific Northwest remain sparsely populated while the Northeast corridor contains many of the country’s densest counties.
According to NOAA, population density in shoreline counties is more than five times the national average. High density means a relatively small coastal land area holds a large share of homes and infrastructure. It also raises the potential number of people affected when roads flood or drinking-water systems lose power.
Growth can strain wetlands that once absorbed water and provided wildlife habitat. Development adds hard surfaces that speed runoff. The NOAA Digital Coast gives communities demographic and land-cover tools for examining those pressures at local scale.
Coastal living brings distinct risks
Hurricanes are the most visible threat, but everyday hazards accumulate too. High-tide flooding can close streets on otherwise calm days. Erosion moves a bluff or beach landward and saltwater can enter freshwater wells as sea level rises or groundwater is heavily pumped.
Risk is uneven within a county. Elevation and building quality influence a household’s exposure, as does evacuation access. Wealth and insurance affect recovery. A county-wide population number cannot reveal those differences, so emergency plans also need neighborhood-level data.
The FEMA Flood Map Service Center provides official flood-hazard information, while NOAA tracks high-tide flooding. Neither resource predicts the future of an individual property on its own. Together with local maps, they help residents understand which processes deserve attention.
Why the number matters beyond the shoreline
Coastal counties contain ports that handle imports and exports for inland consumers. They also support fisheries and shipbuilding, with offshore energy adding another major sector. A disruption at one harbor can affect factories and stores far from the water through delayed materials or higher transport costs.
The Economics: National Ocean Watch explorer tracks employment and business activity in ocean-related sectors. Its data distinguish the ocean economy from the much larger economy located in coastal counties. Keeping those concepts separate prevents an area’s total output from being mistaken for work directly dependent on the ocean.
How coastal population is changing
Long-term growth does not mean every coastal county is expanding. Some urban cores lose residents while nearby counties gain them. Housing costs and an aging population can alter migration, as can repeated disasters. Updated Census population estimates are therefore more useful for current local planning than one national percentage.
Climate change adds another moving variable. Communities are adapting through building standards and flood projects. Some also protect natural shorelines. The number of people exposed will depend on where new housing is built as much as on physical changes in sea level or storms.
The clearest short answer remains about 40 percent. Its importance comes from the concentration behind it: a large share of Americans lives and works on a narrow portion of land where ocean processes meet homes, public services and nationally important infrastructure.
What the national percentage leaves out
A national total combines communities with very different relationships to the water. An apartment resident in a protected urban harbor faces different hazards from a household on a barrier island. Both can fall within a coastal county, yet their elevation, evacuation routes and dependence on marine work may have little in common.
The county definition can also hide distance. Someone near an inland county boundary may live many miles from salt water. Conversely, residents just outside a designated shoreline county can commute to a port or depend on coastal infrastructure. Population estimates describe administrative areas rather than personal identity.
Seasonal visitors are absent from resident counts. A beach community with a small year-round population may hold many more people on a summer weekend. Emergency managers combine tourism and traffic data with housing records to estimate this temporary exposure when planning evacuations.
Definitions should match the decision
Territories require careful treatment too. A statistic for the contiguous United States may omit island communities whose lives are closely tied to the ocean. Analysts should check whether Alaska, Hawaii, Puerto Rico and other U.S. areas are included before comparing two published percentages.
Coastal counties also contain inland-facing neighborhoods whose drainage still connects to estuaries. Pollution and water demand there can influence the coast even without direct wave exposure. Land development adds another influence. The broader watershed definition is often better for water-quality planning.
No single percentage captures all these relationships. The 40 percent estimate works as an accessible national summary, while sound local decisions rely on finer geographic data. Using both geographic levels carefully prevents a memorable statistic from concealing the people and places that need specific plans.
Infrastructure planning may use yet another boundary. A power utility follows its service area, while a port studies freight connections that cross many counties. Public-health officials may focus on evacuation zones. The most useful population count follows the geography of the service or hazard being managed.
Comparisons over time require a stable method. County boundaries and classifications can change and new census results replace estimates. Analysts should retain the definition and source year with every published figure so an apparent population trend does not arise from a revised coastal boundary or a changed method.
Related reading: the biggest threats facing coastal communities and how rising water creates ghost forests.