
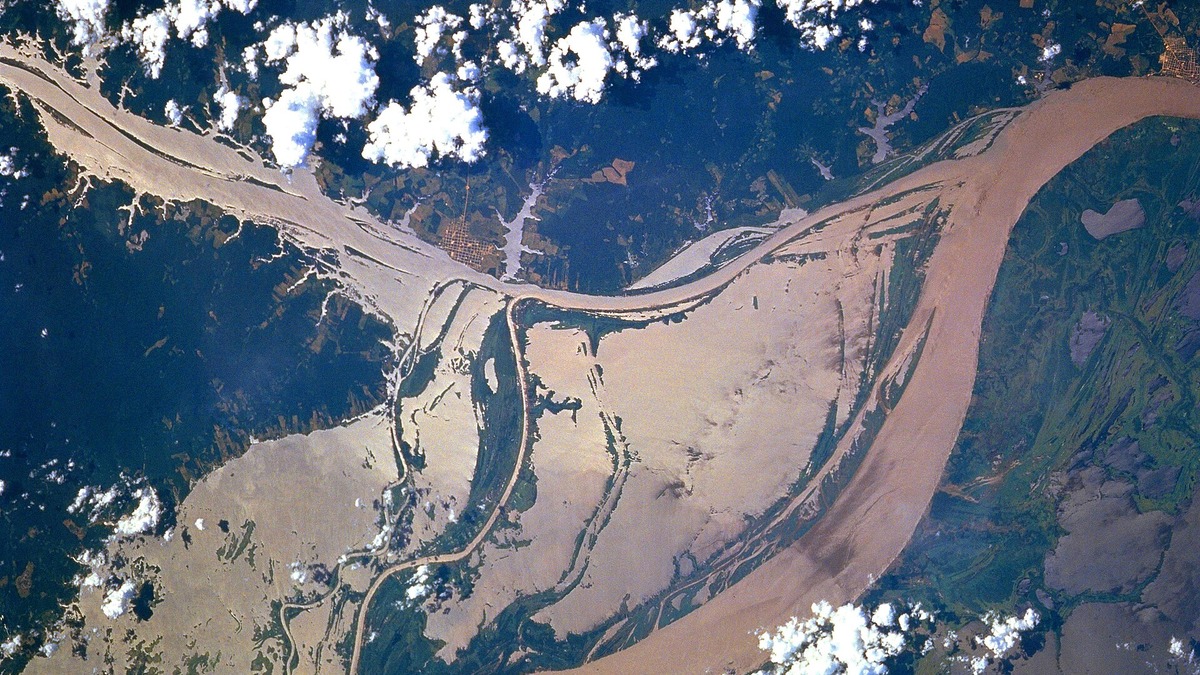
The Amazon is the largest river in the world by water volume when “volume” means average discharge, the rate of water flowing past a point. Widely used modern estimates put its mean flow to the Atlantic near 209,000 cubic meters per second, or roughly 7.4 million cubic feet per second. The exact value depends on the measurement location, period and method.
Average discharge is different from river length, drainage-basin area or the amount of water temporarily stored in a channel and floodplain. The Amazon leads by discharge and also drains the world’s largest river basin. The Nile and Amazon remain involved in a separate length debate because the selected source and mouth determine the result.
Discharge is a rate, not a stored volume
Hydrologists express river discharge as volume per unit time. One cubic meter per second means one cubic meter of water crosses an imaginary section of channel each second. Gauges measure water level continuously, while field crews measure velocity and channel area to build a rating curve that converts level into estimated flow.
A river’s instantaneous discharge changes with rain, snowmelt, groundwater and floodplain storage. An average combines measurements over a stated period. A high-flow observation cannot stand in for the mean and records from wet and dry decades can produce different averages. Values near a river mouth may also include tributaries that lie below an upstream gauge.
The word “volume” in popular rankings is therefore shorthand for average volumetric flow rate. It does not mean that every parcel of Amazon water is gathered in one container. For perspective on Earth’s far larger marine store, see how much water fills the oceans.
How much water the Amazon carries
The U.S. Geological Survey’s classic report The Amazon, Measuring a Mighty River estimated a flow slightly above six million cubic feet per second at the mouth after joint Brazilian and U.S. fieldwork in 1963 and 1964. That is about 175,000 cubic meters per second. The report also concluded that the river contributed roughly 15 percent of all river water entering the oceans.
Later global datasets commonly give a higher mean near 209,000 cubic meters per second and a NASA technical record cites about 219,000 cubic meters per second. Those figures do not overturn the ranking. They show the uncertainty involved in estimating flow across an enormous, tidally influenced mouth from gauges farther upstream.
At Óbidos, about 800 kilometers upstream from the Atlantic, the river is confined enough for systematic measurement. A 1968 USGS analysis calculated an average of 157,000 cubic meters per second for a 1928 to 1946 stage record. Additional tributaries and floodplain channels join below Óbidos, so mouth estimates should be larger.
Why estimates vary
The Amazon mouth is a network of wide channels, islands and tidal flows rather than a single narrow outlet. Water can move through channels around Marajó Island and the Atlantic tide affects the lower river. Defining the cross-section where discharge enters the ocean is harder than placing a gauge across a smaller, confined river.
Measurement technology has changed from current meters and sparse stage records to acoustic instruments, satellites and hydrologic models. Each method samples space and time differently. Researchers may report discharge at Óbidos, estimate contributions downstream or model the whole basin’s runoff. A responsible comparison keeps location and period attached to the number.
Seasonality is another source of variation. Rainfall shifts across the basin and tributaries reach peak flow at different times. Vast floodplains temporarily store water and release it later. The main stem rises and falls by many meters in some places, so an annual mean smooths a hydrologic cycle that residents experience as distinct high- and low-water seasons.
A basin built to gather water
The Amazon basin covers about six million square kilometers, depending on the mapped divide and treatment of coastal drainages. It spans much of northern South America, with the largest share in Brazil and substantial areas in Peru, Bolivia, Colombia, Ecuador and other countries. Water from the Andes travels east across lowlands toward the Atlantic.
Equatorial rainfall supplies the basic abundance. Moisture arrives from the tropical Atlantic and forest evapotranspiration returns large quantities to the atmosphere, where it can fall again downwind. The basin’s enormous area collects rainfall across both hemispheres, which helps spread tributary peaks through the year.
Major tributaries include the Madeira, Negro, Japurá-Caquetá, Purus and Tapajós. Some carry pale, sediment-rich water from the Andes; others drain older, nutrient-poor landscapes and appear dark or clear. Their combined flows produce the main stem’s scale. The USGS record of Amazon sediment research explains that most suspended sediment derives from Andean headwaters even though the river crosses a broad lowland plain.
The Congo is the closest river comparison
The Congo has the world’s second-largest river discharge as a single river system, commonly estimated around 41,000 to 42,000 cubic meters per second. NASA’s paired basin summary gives about 41,800 cubic meters per second. Even allowing for differences among datasets, the Amazon carries about five times as much water on average.
Like the Amazon, the Congo crosses the equatorial zone and drains a humid tropical basin. Tributaries in both hemispheres help sustain flow through the year. The Congo’s drainage area is smaller, however and its average discharge remains far below the Amazon’s.
Some lists place the combined Ganges-Brahmaputra-Meghna delta discharge near or above the Congo, depending on whether connected rivers are treated as one system and which estimate is used. Naming the comparison unit prevents a false precision. The core conclusion remains stable: no other river system approaches the Amazon’s average discharge.
The Mississippi comparison needs compatible endpoints
The Mississippi is North America’s largest river system by discharge, but it carries roughly one-tenth as much water as the Amazon under older compatible USGS estimates. A USGS ranking gives the combined Mississippi system, including the Atchafalaya distributary, an average of about 651,000 cubic feet per second, close to 18,400 cubic meters per second.
Below Old River Control, part of the system’s water goes to the Gulf through the Atchafalaya and the rest continues down the Mississippi channel. A measurement from only one outlet omits the other. USGS reports the two outlets together discharge an average of about 580 cubic kilometers per year.
Current river gauges show real-time conditions rather than the long-term mean used for world rankings. Argo’s river levels today can help interpret recent stage and flow, but a flood peak or drought reading should never be substituted for average discharge.
Discharge does not settle the longest-river debate
River length follows a channel from a selected source to a selected mouth. Headwater networks branch, channels migrate and deltas split. Researchers can choose different candidate sources and paths and improved mapping changes measurements. The Amazon and Nile length debate concerns those definitions rather than how much water flows.
A river may be exceptionally long while draining an arid basin and carrying modest discharge. Conversely, a shorter tropical river can receive intense rainfall across a productive basin. Length is measured in kilometers; discharge is measured in cubic meters per second. Combining the two into one vague idea of “largest” hides the reason each river is remarkable.
Basin area is a third metric. It maps the land contributing surface runoff to a river system. The Amazon ranks first there too, but basin area and discharge are not interchangeable because climate, soils, vegetation, evaporation and water use change the fraction of precipitation that reaches the channel.
Floodplains store and release part of the flow
During high water, rivers spread through floodplain forests, lakes and side channels. This lateral movement stores water, deposits sediment and connects aquatic organisms with terrestrial food sources. Later, stored water drains back toward the main channels. A discharge gauge captures the resulting timing at one cross-section, not the entire volume occupying the floodplain.
Floodplain storage also affects carbon and nutrient transport. Organic matter can decompose, settle or move downstream as water residence time changes. Dams, levees and deforestation can alter that timing. The impact depends on location and scale, so no single basin-wide statement describes every tributary.
Freshwater in rivers is only a small, rapidly moving part of Earth’s water. Most freshwater is locked in ice or stored underground, a distribution explained in where most of Earth’s freshwater is found. The Amazon’s record concerns flux to the ocean, not the planet’s largest freshwater reserve.
What the ranking actually tells us
Average discharge measures the river’s ability to move water through its outlet over time. It influences salinity, sediment transport, navigation, flood behavior and the plume extending into the Atlantic. The Amazon’s freshwater plume can be detected far offshore, but its reach changes with flow, currents and winds.
A single rounded value is useful for scale, while a range of published estimates better represents measurement reality. Older direct work supports roughly 175,000 cubic meters per second at the mouth; widely cited modern summaries cluster around 209,000 to 219,000. All are far above the Congo and Mississippi values compiled with comparable long-term averaging.
The answer is therefore secure even though the last digits are not. The Amazon is the world’s largest river by water volume because it has the greatest average discharge to the ocean. Its lead arises from an immense drainage basin under a wet tropical climate, not from winning every possible river measurement.
Continental drainage patterns
Continue with the major drainage basins of North America.
Discharge is only one way to compare rivers. Argo’s world river and drainage-basin map separates flow from length and basin area, while its guide to north-flowing U.S. rivers explains why compass direction depends on terrain.





