
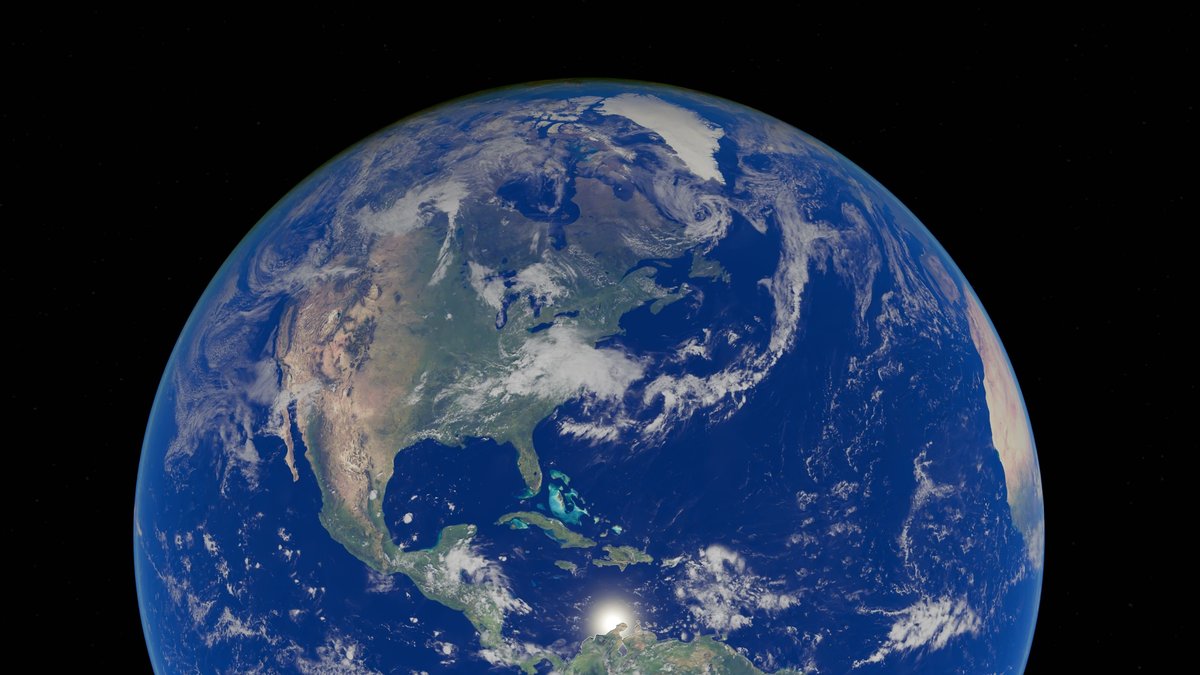
Earth looks blue from space because the ocean spreads across most of its surface and plunges for kilometers below it. That depth gives the ocean an astonishing share of the planet’s water. NOAA estimates that it contains about 1.335 billion cubic kilometers, or about 321 million cubic miles, of water. The estimate combines the immense area of the ocean with the changing depths of its basins. Put another way, almost every drop in Earth’s global water inventory belongs to the ocean.
The NOAA National Ocean Service’s overview of Earth’s water puts the ocean share at about 97%. The remaining water is spread through many smaller stores. They include glaciers and ice caps. Groundwater is another store. Lakes and rivers also hold water. The atmosphere, soil and living things hold water too. Those stores matter enormously to ecosystems and people, yet their combined volume is far below the ocean’s immense reserve.
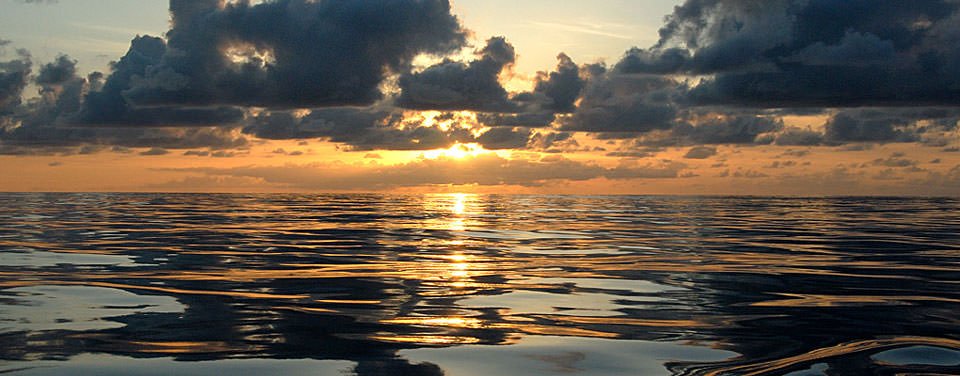
The ocean holds almost all of Earth’s water
Volume is a measure of three-dimensional space. A cubic kilometer is a cube one kilometer long, one kilometer wide and one kilometer high. The USGS estimate places all water on, in and above Earth at about 1.386 billion cubic kilometers, or 332.5 million cubic miles. Its table assigns 1.338 billion cubic kilometers to oceans, seas and bays.
That inventory helps show why the ocean dominates the planet’s water budget. The USGS figure is slightly larger than NOAA’s 1.335 billion cubic kilometers, but both estimates point to the same scale. A cubic mile of water holds more than 1.1 trillion gallons, according to USGS. Numbers this large are difficult to picture, so they work best as a reminder of proportion at an everyday scale.
The surface area tells only part of the story. Ocean water covers roughly 70% of Earth’s surface, then continues downward through deep basins and trenches. A wide, deep basin contains much more water than a shallow lake of the same surface area. The ocean’s vast footprint and depth together make it Earth’s largest water store.
Consider the shape of the planet’s ocean basins. Broad continental shelves lie near coasts, while much deeper water fills the open ocean. Underwater ridges and trenches change the shape of the seafloor from place to place. These features shape a global estimate built from many observations. The result remains clear: the total water inventory is overwhelmingly ocean water.
Volume also makes the coast-to-ocean transition hard to picture. A narrow beach slopes into the continental shelf, then toward far deeper water beyond it. The visible surface sits above a huge vertical space. That hidden depth is central to the ocean’s extraordinary total.
Why 96.5% and 97% both fit
Two familiar percentages can seem to disagree at first glance. The USGS table lists 96.5% of Earth’s total water in oceans, seas and bays. NOAA describes the ocean’s share as about 97%. Both statements summarize global estimates and both are useful at their stated level of precision.
The difference begins with rounding and with the inventory used. NOAA gives 1.335 billion cubic kilometers in the ocean from an estimate by NOAA’s National Geophysical Data Center, alongside a total of 1.386 billion cubic kilometers. The USGS table uses 1.338 billion cubic kilometers for oceans, seas and bays. Its percentage is shown to two decimal places before being rounded in many summaries. A whole-number phrase such as “about 97%” communicates the same dominant share.
Water inventories are snapshots of connected stores. The water cycle moves water among the ocean, atmosphere, land and ice. It also connects rivers with underground rock. Source tables also name saline stores in slightly different ways and round their totals. The careful takeaway is that the ocean holds roughly 96.5% to 97% of Earth’s water. The wording reflects each source’s definitions and rounding.
This range shows how scientists communicate rounded global quantities. A report may retain more decimal places for a table, while a short public explanation may use a whole percentage. The figures describe volume. Ocean surface coverage measures a different dimension. Depth makes the ocean’s share by volume much larger than its share of the surface.
Most of the remaining water is frozen or underground
The other few percent of Earth’s water is distributed unevenly. The USGS table estimates that ice caps, glaciers and permanent snow contain 1.74% of all water. Freshwater makes up only a small share of the total and much of that freshwater is stored where it cannot be reached quickly. The table places more than two-thirds of freshwater in ice caps and glaciers.
Another large freshwater store is groundwater, water held in cracks and pores beneath the surface. USGS estimates that fresh groundwater accounts for about 30.1% of freshwater. Some groundwater returns naturally to rivers, springs, or the ocean. Some stays underground for long periods, depending on the geology and how quickly water can enter or leave an aquifer.
Lakes, rivers, wetlands and soil moisture hold much smaller volumes. Atmospheric vapor and water in living things do as well. Their small shares supply communities, support habitats and help keep the water cycle active. Rivers and lakes provide water for many communities. Atmospheric water helps form clouds and precipitation. The global percentages describe where water is stored at a given time. Access, quality, location and timing determine how useful a particular supply is.
Saline water also occurs outside the ocean. The USGS inventory includes saline groundwater and saline lakes, which are counted separately from freshwater stores. This is another reason the labels in a water table matter. A percentage for “ocean water” can have a slightly narrower scope than a percentage for all saline water. Reading the category alongside the number keeps comparisons accurate.
A giant store that keeps water moving
The ocean is a deep reservoir within a busy planetary system. NOAA reports an average ocean depth of about 3,682 meters, or 12,080 feet. Sunlight supplies energy that turns liquid water at the surface into water vapor. As air cools, vapor can condense into clouds and later fall as rain or snow. Gravity then guides water across land and through the ground.
Much of that returning water eventually reaches the sea through streams, rivers, groundwater flow, or melting ice. The cycle keeps changing the location and form of water, even though the largest share remains in the ocean. Ocean water is saline because dissolved materials have accumulated over very long periods. The USGS says typical seawater has a salinity of about 3.5% by weight.
Seawater requires desalination before it becomes drinkable water. Desalination can produce freshwater from seawater, but it requires facilities and energy. The ocean’s larger role is planetary: it stores water, supplies moisture to the atmosphere, supports marine life and connects weather on land with conditions at sea. Its size sets the scale for every conversation about Earth’s water. It also makes the ocean central to questions about weather and climate.
Over long periods, the size of ocean stores can change as water shifts into or out of ice sheets and glaciers. Warmer and colder climates alter how much water is held as land ice, which affects sea level. Day to day, the movement is easy to see in clouds and rain. It also appears in rivers and waves. The enormous ocean reservoir provides the background volume for those familiar changes.
The global volume is continually redistributed through the system in Argo’s ocean currents overview. A separate explainer covers why ocean water is salty.





