Ocean observing data helps people describe what the sea is doing now, anticipate what it may do next and understand how it is changing over years. Measurements of currents and waves feed weather forecasts alongside records of water properties. The same data supports navigation, environmental response and search planning. The value comes from combining many instruments and delivering their records quickly enough for decisions.
NOAA coordinates much of this work through the U.S. Integrated Ocean Observing System. Its summary of how ocean observing data is used highlights near-real-time current maps for rescuers, spill responders and harmful algal bloom forecasts. Researchers also preserve observations for climate and ecosystem studies.
Instruments observe different parts of the ocean
No single sensor captures the whole sea. Buoys measure conditions at fixed points, while ships lower instruments through the water column. Autonomous floats drift through deep basins and periodically rise to transmit profiles. Gliders move slowly across regions, collecting repeated sections that would be costly to sample by ship.
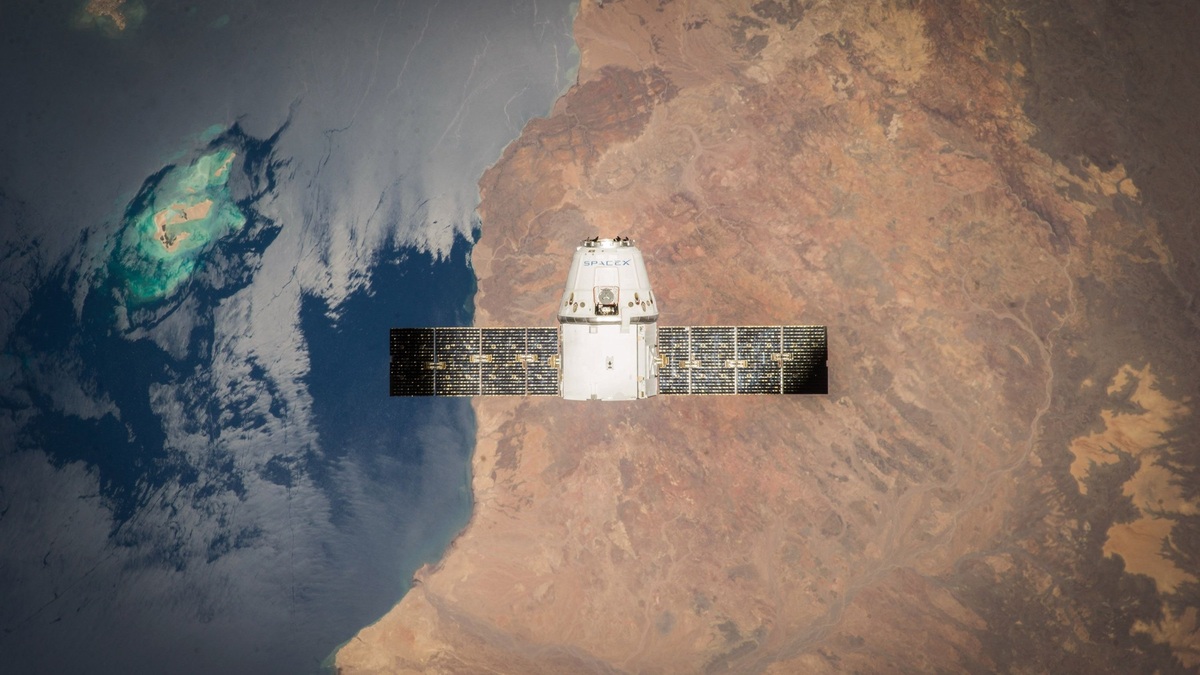
Satellites cover broad areas and repeatedly measure surface properties such as temperature, sea level and ocean color. They cannot directly replace instruments below the surface. Combining remote sensing with in-water observations reveals both the large pattern and the vertical structure beneath it.
Coastal high-frequency radar estimates surface-current speed and direction by transmitting radio waves toward the sea and analyzing the returned signal. Networks of radar sites can map currents across a wide nearshore area. The IOOS national high-frequency radar network distributes those maps for operational and scientific use.
Animals can carry instruments too. Tags on seals and other marine species have collected profiles in places difficult for ships to reach, although sampling follows the animals’ movements rather than a fixed grid. Moorings observe one location continuously, making the two approaches useful for different questions.
Weather and ocean forecasts depend on observations
The ocean stores and transports enormous amounts of heat. Sea-surface temperature can influence the energy available to tropical cyclones, while deeper heat content affects whether a storm encounters warm water below the surface. Observations give forecast models a more accurate starting state.
Waves and currents also determine conditions experienced by vessels and coastal communities. The National Data Buoy Center provides buoy measurements used in marine forecasting and public safety. Tide gauges add water-level records near ports and shorelines.
Data assimilation blends observations with a numerical model while respecting physical relationships. The result fills gaps between instruments and produces a coherent estimate of present conditions. A model then projects that state forward and later observations reveal where its forecast diverged from reality.
Forecast quality depends on broad coverage plus careful calibration and timely delivery. A sensor can be precise yet provide little operational value if its report arrives after an event. Quality control flags suspicious readings without erasing unusual conditions simply because they are rare.
Redundancy protects an operational service. Storms can damage buoys and communications can fail. Biological growth may also interfere with sensors. Overlapping instruments and backup data paths help maintain a usable picture while technicians repair a station.
Current maps narrow a search area
When a person or vessel is missing, rescuers estimate how wind and water will move the target from its last known position. Surface-current observations reduce uncertainty in that drift calculation. Search planners can focus aircraft and ships where detection is most likely.
The U.S. Coast Guard’s search-and-rescue tools incorporate environmental information and target behavior. Different objects drift differently because their exposed area and shape change the balance between wind and current.
Fresh observations let planners update the search as conditions evolve. A current front or coastal eddy may pull the likely positions away from a simple straight-line estimate. Uncertainty never disappears, but better environmental data can reduce the water that must be searched.
Time stamps are crucial in this work. A current map from yesterday may be misleading after a wind shift or tide change. Operational centers track when observations were collected and when model guidance was issued so planners do not confuse an old field with present conditions.
Spill and bloom forecasts follow moving water
Oil-spill responders need to know where released material may travel and which shorelines could be exposed. Current and wind data feed trajectory models alongside wave information. Aircraft observations and satellite views help check the predicted position. The NOAA GNOME modeling suite supports trajectory analysis and uncertainty estimates.
Harmful algal bloom forecasting uses water conditions alongside biological sampling and remote sensing. Currents can transport a bloom toward beaches or shellfish-growing areas, while temperature and nutrients influence growth. Forecasts support targeted sampling and public-health decisions rather than claiming that every patch of discolored water is harmful.
Water-quality managers use observing data to trace river plumes, low-oxygen zones and sediment movement. Repeated measurements show when a condition is local and short-lived or part of a broader seasonal pattern. The Environmental Protection Agency’s aquatic surveys complement operational networks with standardized assessments of ecological condition.
After an incident, archived data establish what conditions were like before and during the event. Those records can improve later models and help researchers separate an unusual episode from normal variability.
Long records reveal ocean change
Climate questions require observations that remain comparable across decades. Researchers account for instrument changes and station moves, then address gaps before interpreting trends. A long record of sea level or temperature becomes useful only when its history and uncertainty are documented. The same requirement applies to oxygen records.
The international Global Ocean Observing System coordinates essential variables and encourages data exchange across national boundaries. Ocean currents do not stop at political borders and a forecasting system in one country may depend on measurements collected far away.
Open archives allow scientists to revisit observations with new methods. They also support planning for ports and fisheries, alongside coastal infrastructure. An operational network therefore serves two time scales at once: minutes during an emergency and decades during an assessment of environmental change.
Useful data needs context
Every ocean measurement represents a place, depth, time and method. Users need metadata describing calibration and quality flags before combining records. A surface reading cannot automatically describe the seabed and one buoy cannot represent an entire coast.
Observations become actionable when specialists translate them into maps, forecasts and clear uncertainty. Raw data remains essential for verification, but the final decision may depend on a current arrow, a predicted water level or a search probability. Maintaining both the instruments and the people who interpret them keeps the observing system useful.
Standards make exchange possible. Shared formats and agreed variable names allow software to combine records from several operators. Open access also lets commercial users and researchers build new products while tracing each value back to the instrument and organization that supplied it.
People decide what the network should observe
Instrument placement reflects practical priorities. A busy harbor needs reliable water levels and currents, while fisheries scientists may need temperature profiles across a shelf. Communities facing recurrent flooding can identify gaps that a national map overlooks. Observation plans balance those needs against cost and maintenance access, while considering the expected life of each sensor.
Networks improve when users report whether products answer real decisions. A map may be scientifically sound yet arrive in an awkward format for a rescue center. Feedback can change update frequency and displays while improving quality notes, all without changing the underlying measurement. Sustained observing is a partnership between data producers and the people acting on the information. Training helps users recognize quality flags and select the right depth. It should also help them distinguish measured values from model estimates. Clear public documentation should make those distinctions visible rather than leaving them hidden inside technical metadata records.
Related reading: how ocean gliders gather data and how satellites observe the ocean.