
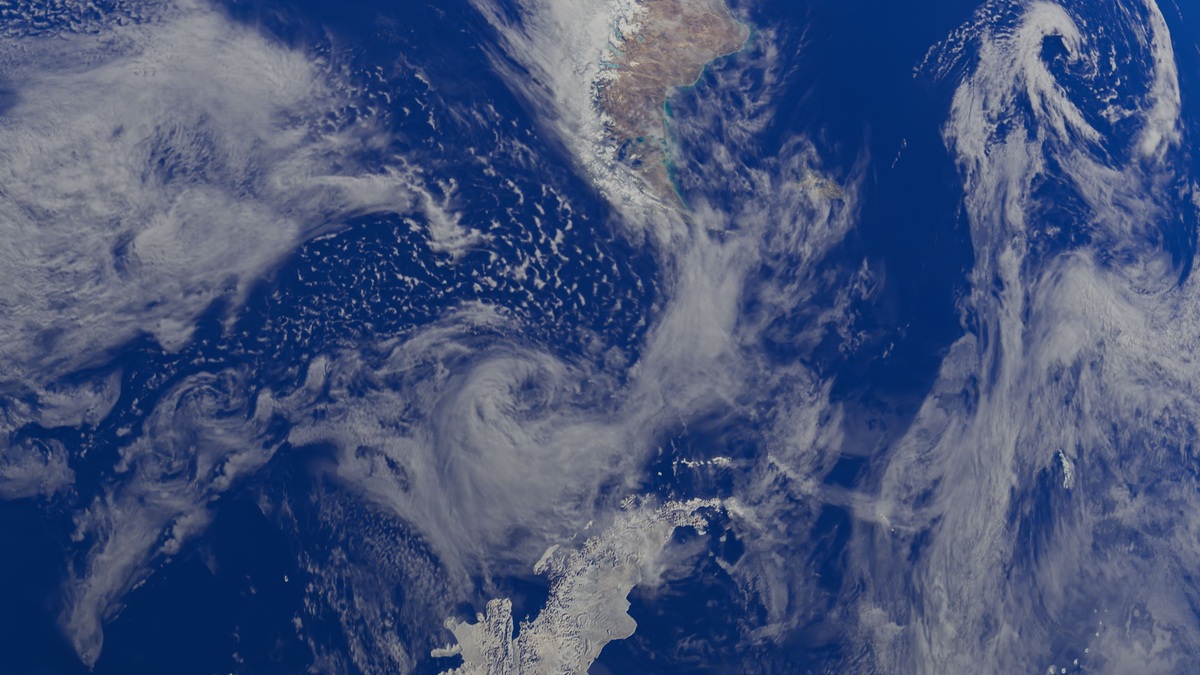
Satellites observe the ocean by measuring energy reflected or emitted from its surface, then converting those signals into maps of temperature, color, height, roughness and ice cover. They do not photograph everything in the same way. Each instrument is designed for a particular part of the electromagnetic spectrum.
From orbit, a sensor can revisit vast areas beyond the continuous reach of ships. Buoys sample directly but cannot supply the same spatial coverage. NOAA’s overview of satellite ocean observation includes sea surface temperature, ocean color, coral reefs and sea ice. Satellite systems also relay data from instruments in the water.
Remote sensing measures the surface, so oceanographers combine it with observations collected below. Buoys and floats help validate satellite products, supported by measurements from research vessels. Together they reveal patterns that neither system could resolve alone.
Ocean sensors measure light and heat
Passive instruments receive radiation without sending a pulse toward Earth. Visible-light sensors record sunlight reflected from the ocean. Infrared radiometers detect thermal radiation emitted by the sea surface, which can be translated into temperature after atmospheric effects are corrected.
Microwave instruments measure longer wavelengths. They can observe through many clouds that block visible and infrared sensors, although their spatial detail may be coarser. Microwave measurements support products for surface temperature, wind and sea ice.
A satellite image is therefore a processed measurement rather than a simple camera view. Algorithms account for the viewing angle and absorption by the atmosphere, with sensor calibration applied as another essential correction. Ground teams then compare the result with reliable observations at sea.
Sea surface temperature reveals moving water
Warm currents and cold upwelling zones create recognizable thermal patterns. Infrared instruments such as VIIRS can map those contrasts at fine resolution when skies are clear. Repeated passes show fronts and eddies. They also reveal changes in the position of major currents.
NOAA distributes operational sea surface temperature products that blend observations into regular grids. These maps support weather forecasting and fisheries work. They also help identify marine heatwaves that may stress ecosystems.
Clouds leave gaps in many infrared images. Analysts reduce the problem by combining measurements from several satellites or adding microwave data. Buoys provide an independent check on temperature near the surface.
A thermal map shows only the skin of the ocean. Scientists need profiles from floats or ships to learn how far a warm layer extends downward. The relationship between surface and depth changes with wind, sunlight and mixing.
Ocean color tracks material in the upper water
Seawater absorbs and scatters different wavelengths of sunlight. Phytoplankton pigments alter that signal. Suspended sediment and dissolved organic matter produce their own effects. Ocean-color instruments separate narrow bands of visible light to estimate what contributes to the observed color.
NASA’s PACE mission uses a hyperspectral Ocean Color Instrument to distinguish many wavelengths. Its products can improve estimates of phytoplankton communities and aerosols, while extending the long satellite record of ocean color.
Color maps help track river plumes and some harmful algal blooms. They are not automatic diagnoses. Clouds can complicate interpretation, especially over shallow bottoms or water containing mixed substances. Local sampling remains necessary when health decisions depend on species or toxin levels.
The NASA Ocean Color program maintains calibrated data from several missions. Long records allow researchers to examine seasonal cycles and changes in biological productivity across ocean basins.
Chlorophyll is a useful proxy, not a direct count of every organism. Models translate water-leaving light into concentrations and their uncertainty differs between clear open ocean and complex coastal water.
Radar measures height, wind and roughness
Active instruments transmit energy and measure the return. A radar altimeter sends pulses toward the ocean and times their echoes. After correcting for the spacecraft’s orbit and atmospheric delays, scientists can calculate sea surface height.
Small height differences reveal ocean circulation because gravity, Earth’s rotation and pressure balance help organize currents. NOAA’s satellite altimetry records have supported continuous global and regional sea-level analysis since the early 1990s.
Scatterometers infer near-surface wind from radar backscatter. Wind changes the texture of the water, altering how much energy returns to the sensor. Synthetic aperture radar can resolve detailed patterns of waves, ice and surface slicks under suitable conditions.
Satellites map sea ice and shallow coastal features
Passive microwave observations are central to daily estimates of sea-ice concentration because polar darkness does not stop them. Ice and open water emit microwave energy differently. Analysts use those contrasts to map extent. Uncertainty rises near coastlines and during surface melting.
Visible imagery supplies finer detail when daylight and weather cooperate. Radar can identify leads and ice deformation. Combining sensors improves navigation support and climate records because no single wavelength performs best under every condition.
In clear shallow water, multispectral imagery may reveal reefs, seagrass or seafloor patterns. Depth and turbidity affect the signal, as does bottom type. Field measurements are required to calibrate habitat maps and separate genuine change from water-column effects.
The NOAA Coral Reef Watch program uses satellite temperature data to assess heat stress that can cause coral bleaching. Its alerts illustrate how an orbital measurement becomes an ecological decision tool.
Ocean measurements become useful after careful processing
Satellites send raw instrument data to receiving systems, where calibration and geolocation place each measurement correctly. Processing removes poor-quality observations and applies physical retrieval algorithms. Gridded products may blend several passes or satellites into daily composites.
Validation protects the record from drift. The Global Drifter Program maintains satellite-tracked buoys that measure conditions at the surface. Fixed buoys and ships add comparisons across different environments.
Coverage and consistency are the main orbital advantages. A satellite can follow a basin-scale heat pattern or measure sea level repeatedly across decades. Its limits are equally important. Most signals represent the top layer, while clouds block some wavelengths. Indirect retrievals also carry assumptions.
The strongest ocean observing system is a network. Satellites provide the map, while instruments in the water add direct measurements at depth. Models join those observations through time. The resulting forecasts and climate records are more complete than those from any isolated sensor.
Resolution determines which questions a satellite can answer
Every measurement involves tradeoffs among spatial detail, revisit time and sensitivity. A sensor that resolves a small coastal feature may cover a narrower swath, requiring more time to map the globe. A geostationary instrument can watch one region frequently, whereas a polar-orbiting satellite builds global coverage as Earth rotates beneath it.
Temporal resolution is vital for events that change over hours, such as a storm or rapidly developing bloom. Long-term climate work places greater emphasis on calibration and continuity. The NOAA satellite fleet combines orbital designs because weather operations and climate records do not have identical requirements.
Pixels are areas, not point samples. A coastal pixel can combine open sea with shallow water and part of it may fall on land. The mixture creates a complex signal. Scientists choose products appropriate to the scale of the question, inspect quality flags and retain uncertainty instead of treating every colored map cell as an exact observation.
Orbits make repeated global records possible
Polar-orbiting spacecraft pass near both poles and observe different strips on successive revolutions. Geostationary spacecraft remain over the same longitude, offering rapid views of a large fixed region. Altimetry missions use carefully chosen repeating tracks to compare sea height over time.
Maintaining a climate record requires overlap between old and new missions. During overlap, teams identify offsets by comparing the sensors. Stable reference observations also help separate a genuine ocean trend from changes in instruments, algorithms or orbital conditions.
Continuity converts snapshots into evidence. A single pass can locate an eddy, but years of consistent passes show its seasonal behavior. Decades of calibrated altimetry reveal sea-level trends and changing circulation, giving satellite oceanography much of its scientific value. International missions also reduce the risk that one spacecraft failure will interrupt an essential record.
Related reading: how satellites measure ocean salinity and how ocean observations support habitat maps.





