
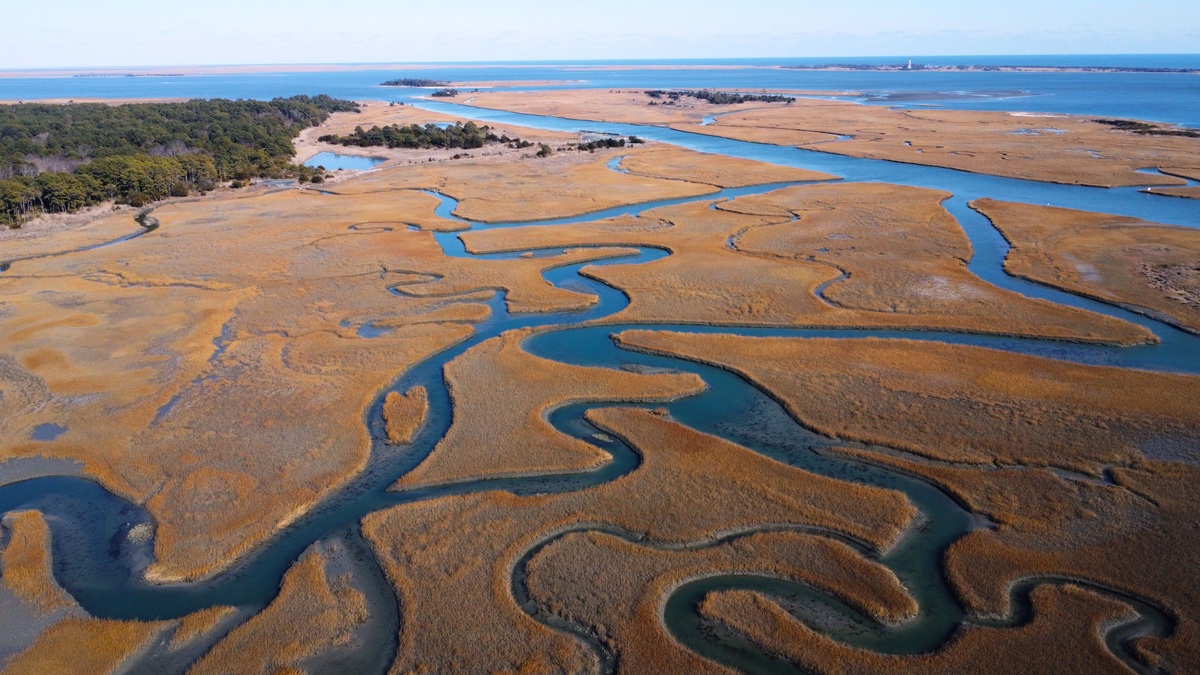
The Chesapeake Bay is the largest estuary in the United States. It stretches roughly 200 miles from the Susquehanna River at Havre de Grace, Maryland, to the Atlantic Ocean between Cape Charles and Cape Henry in Virginia. Across that distance, river water gradually mixes with salt water pushed inland by tides.
NOAA’s profile of the Chesapeake Bay estuary describes a watershed spanning parts of six states and the District of Columbia. The estuary’s scale comes from this drainage area as much as from the open water visible on a map.
Its size supports a remarkable range of habitats and human uses. Shallow grass beds, deep channels, tidal marshes and tributary rivers share one connected system. Conditions in any location depend on tides, rainfall, river flow and what happens far upstream.
An estuary is a mixing zone
An estuary forms where rivers meet the sea within a partly enclosed coastal basin. Fresh water flows toward the ocean while tides carry salt water inland. The mixture is called brackish water and its salinity changes from the upper Bay to its mouth.
The boundary is never fixed. Heavy rain can push fresher conditions southward, while drought allows saltier water to move farther north. Winds can temporarily pile water against one shore or move it out of shallow areas.
The Chesapeake’s long shape creates a clear salinity gradient. Freshwater species dominate its upper reaches. Farther south the lower Bay resembles the nearby coastal ocean and organisms adapted to brackish or marine water become common.
The Chesapeake Bay Program’s estuary overview explains how these transitions produce open water, marsh, beach, mudflat and reef habitats. Each occupies a setting defined by depth and salinity under a particular degree of exposure.
The Susquehanna supplies most river water
The Susquehanna River enters at the Bay’s northern end and provides the largest share of its freshwater flow. Other major tributaries include the Potomac, James, Rappahannock, York and Patuxent. Thousands of smaller streams connect local landscapes to the main estuary.
The watershed covers about 64,000 square miles. Water falling in parts of New York or West Virginia can eventually reach the Chesapeake, carrying dissolved nutrients and eroded soil along the way. The Bay therefore records land-use decisions made far beyond its shoreline.
Seasonal flow changes the system. Spring runoff generally delivers more fresh water and nutrients. During lower-flow periods, salt can penetrate farther up the Bay. Scientists track river discharge because it helps explain year-to-year changes in water clarity and oxygen.
The broad watershed supports millions of residents across farm country as well as cities. Baltimore and the Hampton Roads ports sit on the estuary, while Washington, D.C., lies beside the tidal Potomac. Commercial shipping uses naturally deep sections and maintained navigation channels.
According to an EPA Chesapeake Bay fact sheet, excessive nitrogen, phosphorus and sediment enter from several kinds of land and wastewater sources. The multi-state setting makes restoration a regional undertaking.
A drowned river valley formed the Bay
The modern Chesapeake occupies the lower Susquehanna River valley. During the last ice age, sea level was much lower because enormous volumes of water were stored in ice sheets. The river cut a valley across land that is now submerged.
As the climate warmed and ice melted, rising seas flooded that valley. The Bay took on a form close to its current outline several thousand years ago. Deep troughs along the bottom still trace parts of the former river channel.
This origin helps explain the Bay’s unusual combination of great area and shallow average depth. Much of its water is less than 30 feet deep. A deeper channel nevertheless runs along the old valley and supports navigation.
Shallow water can be highly productive
Sunlight can reach much of a shallow estuary’s bottom when the water is clear. Submerged aquatic vegetation then grows in beds that shelter young fish and blue crabs. The plants slow waves and hold sediment. During photosynthesis, they also release oxygen.
Oyster reefs create another important habitat. Oysters filter suspended particles as they feed, while the reef’s hard surface provides shelter in an otherwise soft-bottom environment. Harvest, disease and poor water quality greatly reduced historic oyster abundance, prompting restoration in selected tributaries.
The Bay supports migratory and resident fish. Striped bass use its tributaries for spawning. American shad move from the ocean into rivers and American eels make the opposite reproductive journey to the Sargasso Sea.
Birds connect the estuary to an even larger geography. Waterfowl arrive along the Atlantic Flyway, feeding in marshes and shallow water. Bald eagles, ospreys and herons depend on fish-rich shorelines.
Productivity has limits. When large nutrient loads stimulate algae, the blooms can shade underwater grasses. Decomposition consumes dissolved oxygen after algae die, creating deep areas where fish and bottom animals struggle to survive.
Water quality changes across the Bay
Scientists cannot summarize the Chesapeake with one sample. Salinity, temperature, clarity and oxygen vary with depth and location. A tributary near a city may face different pressures from a relatively open section of the lower Bay.
Fresh water often floats above denser salt water. This layering, called stratification, can limit the mixing that carries oxygen downward. Warm summer water holds less dissolved oxygen, increasing the risk of low-oxygen conditions in deeper channels.
Monitoring programs combine boat samples, fixed sensors, aerial surveys and computer models. The Bay Program’s vegetation monitoring, for example, uses aerial imagery and field observations to estimate the area and density of underwater grasses.
Measurements allow managers to distinguish a short-lived weather effect from a persistent trend. They also show why improvements may take time. Nutrients stored in groundwater can continue reaching streams years after practices change on the land.
Restoration reaches beyond the shoreline
Efforts to improve the Bay include upgrading wastewater treatment, reducing farm runoff, managing stormwater and restoring wetlands. Streamside trees intercept some pollution before it enters waterways and shade streams used by fish.
The Chesapeake Bay Total Maximum Daily Load establishes watershed-wide limits for nitrogen, phosphorus and sediment. Jurisdictions decide how to meet their shares through local programs. The framework treats tributaries and the main Bay as parts of the same water system.
Habitat projects complement pollution controls. Oyster restoration builds reefs in targeted rivers, while fish-passage work reconnects spawning habitat above dams. Protecting marsh migration corridors can give tidal wetlands room to move inland as sea level rises.
Sea-level change has a regional component. The mid-Atlantic coast experiences global ocean rise along with land subsidence. NOAA’s sea-level trend records show how tide gauges measure the combined local result.
The title of largest U.S. estuary describes far more than an expanse of water. The Chesapeake is a network that joins mountain streams, farms, cities, marshes and the Atlantic. Its health depends on keeping those connections in view.
Size can be measured in several ways
Comparisons among estuaries depend on the boundary and measurement used. Surface area, water volume, shoreline length and watershed size answer different questions. NOAA and Chesapeake authorities call the Bay the nation’s largest estuary because of its extensive connected estuarine waters, while some technical comparisons distinguish the main Bay from its tidal tributaries.
The Chesapeake remains an exceptionally large system under any practical definition. Its importance follows from both geography and connectivity: water from a vast drainage basin enters a shallow tidal basin before reaching the Atlantic. Those proportions make land management unusually influential over conditions in the estuary. They also explain why measurements from one tributary cannot represent the entire Bay. Comparisons are most useful when they state which waters and metrics they include.
Related reading: the four geological types of estuaries and how ghost forests form along coasts.





