
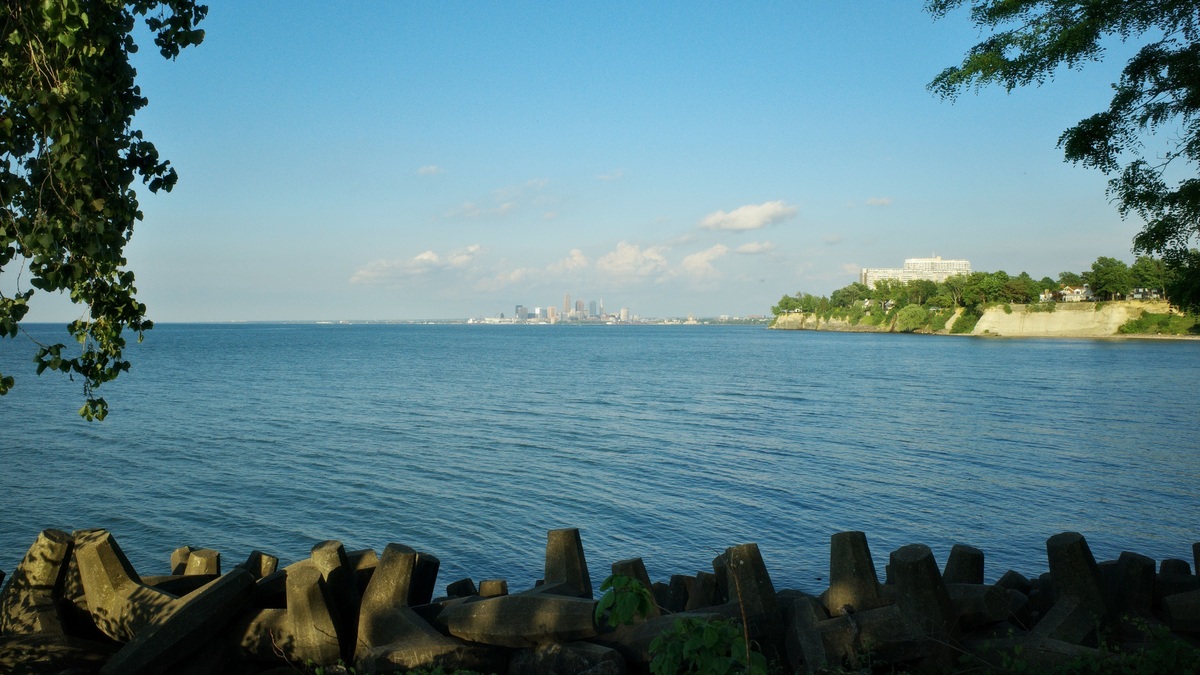
Lake Erie’s current level depends on whether the reader needs a lake-wide average or conditions at one shoreline. The US Army Corps of Engineers publishes daily Great Lakes water levels with provisional station observations and a mean for Erie. NOAA’s Lake Erie stations are better for local, near-real-time changes.
No evergreen page should freeze today’s value into permanent text. Official dashboards identify the observation date, use International Great Lakes Datum 1985 and revise provisional means when needed. The links below remain useful as the lake moves through its seasonal cycle.
Check the official Lake Erie level
The Corps page lists Toledo and Cleveland gauges in the United States together with Canadian stations at Port Stanley and Port Colborne. When the necessary observations are available, it calculates an Erie mean. The same page supplies the long-term monthly average and historical maximum or minimum for comparison.
NOAA’s station selector offers real-time observations updated every six minutes. Choose the Great Lakes – Lake Erie region, then open the station nearest the shoreline of interest. One station may differ noticeably from the opposite end during a wind event.
For the next several days, NOAA’s Lake Erie Operational Forecast System provides model guidance. LEOFS runs four cycles daily and projects water level, currents and water temperature out to 120 hours. Model output carries uncertainty and should be read alongside observed stations.
Local gauges and lake-wide means answer different questions
A gauge records the water surface at a fixed place. It captures short-lived changes important to harbors, beaches and low-lying shorelines. The lake-wide mean combines selected gauges to estimate the broader surface and is more useful for monthly hydrologic comparisons.
Lake Erie is long, shallow and aligned roughly southwest to northeast. Strong southwest winds can push water toward Buffalo while lowering it near Toledo; winds from the opposite direction reverse the pattern. This wind setup changes local depth without adding water to the lake.
After forcing eases, water can oscillate back and forth in a seiche. Local peaks can occur after the strongest wind has passed. Argo’s discussion of Lake Erie hazards explains why rapid changes deserve attention even when a monthly mean looks ordinary.
Use the right time scale
Real-time gauge data are suited to immediate shoreline awareness. LEOFS addresses the coming hours and days. The Corps’ six-month coordinated forecast projects monthly mean levels across a range of possible weather conditions.
The six-month bulletin shows recent monthly means, a most-probable projection and a shaded range. Values represent still-water elevations averaged across the lake and are referenced to IGLD 1985. They should not be read as predictions of individual storm surges at Toledo or Buffalo.
Why Lake Erie levels change through the year
Lake Erie receives most of its inflow through the Detroit River from Lakes Superior, Michigan, Huron and St. Clair. Rain and tributary runoff add water within the Erie basin. Water exits through the Niagara River, with smaller diversions affecting the connected system.
Seasonal levels commonly rise during spring as runoff increases and evaporation remains lower, then decline later as evaporation strengthens. The precise peak shifts from year to year. Ice cover can suppress winter evaporation, while warm open water can increase it.
Longer changes reflect the combined water supplies of the upper Great Lakes. Because the Great Lakes are connected, persistent wet or dry conditions upstream can influence Erie long after a local storm ends.
Lake Erie is not regulated like Lake Ontario
There is no outlet structure that directly regulates Lake Erie’s level in the manner used for Lake Ontario at the Moses-Saunders dam. Niagara River diversions and control works serve power generation and Niagara Falls objectives, but they do not provide a storage valve capable of setting Erie to a chosen elevation.
The lake’s level therefore follows its water balance and hydraulic connection to surrounding channels. Forecasting uses observed supplies, weather scenarios and lake behavior rather than a planned weekly outflow schedule. Comparing Erie and Ontario without this distinction leads to mistaken claims about human control.
Datum, chart depth and shoreline impact
IGLD 1985 is the shared vertical reference for Great Lakes elevations. NOAA gives Lake Erie’s low-water or chart datum as 173.5 meters, or 569.2 feet, IGLD 1985. A reported water level is an elevation above the same reference, while navigational depth combines that elevation with chart soundings.
A few centimeters across a lake-wide mean represent a large volume, yet shoreline impacts depend on local topography and weather. Waves riding on wind setup can reach structures even when the mean is below a historical record. Emergency guidance should come from local forecasts rather than the monthly bulletin alone.
For broader context, compare Great Lakes conditions and the five-lake system. Always preserve the number’s timestamp, units and spatial meaning. Those details determine whether a Lake Erie level is useful or misleading.
Forecast ranges reflect uncertain weather
Great Lakes forecasts begin with observed basin conditions and then account for plausible precipitation, runoff and evaporation. Weather several months ahead cannot be specified exactly. The Corps therefore presents a central projection surrounded by a range of possible outcomes rather than a single guaranteed elevation.
A forecast range is not a probability statement unless the product defines it that way. Readers should use the interpretation text accompanying the bulletin. New monthly forecasts incorporate more recent observations, so an older graphic should be archived with its publication date instead of compared silently with current measurements.
LEOFS addresses a different uncertainty. Its hydrodynamic grid resolves the shallow western basin more finely and uses atmospheric forcing to estimate local change. NOAA calls the result forecast guidance, acknowledging that station observations remain the direct record of what occurred.
Water supply is measured across the basin
Hydrologists describe net basin supply as precipitation on the lake plus runoff, minus evaporation. Connecting-channel flows carry the accumulated influence of upstream lakes. Each term has measurement uncertainty and evaporation is usually estimated rather than captured by one instrument over the entire surface.
Lake Erie’s shallow average depth allows it to warm and cool faster than the other Great Lakes. Temperature affects evaporation and ice cover, while wind readily redistributes its water. These traits explain why local daily readings can be lively even when the lake-wide seasonal curve changes gradually.
For reproducible use, save the station ID or official product URL with the time, unit and datum. If a figure comes from the monthly bulletin, name the issue month. This small record separates a defensible time-stamped water-level observation from a number whose meaning can no longer be reconstructed.
Preserve the evidence behind every reading
Public dashboards may display preliminary data before final quality review. NOAA’s continuous monitoring detects many sensor problems, but an individual spike can still require checking against nearby stations and flags. The Corps explicitly labels its daily compilation provisional. A research citation should use verified or finalized data when available.
Wind setup can also reverse quickly, so a reading shared without its station and time may alarm one shore while understating conditions on another. Pair local observations with current marine forecasts during storms. For seasonal reporting, return to the lake-wide mean and coordinated bulletin, which answer the broader hydrologic question.
The official products fit together across time scales. Gauges record conditions, while LEOFS supplies short-horizon spatial guidance. The Corps projects monthly means. Keeping those products separate protects the distinction between measurement, model guidance and seasonal outlook.
Conversions can introduce a small apparent disagreement. One meter equals about 3.281 feet, but dashboard values may be rounded after conversion. Compare the original unit before deciding two agencies conflict and retain the displayed precision rather than adding unsupported decimals.
Rapid water-level oscillations are covered in Argo’s guide to lake seiches. The Great Lakes also contain freshwater estuaries where rivers and lakes meet.





