
Great Lakes Conditions Today
- Data updated
- Source data dated
- Editorially updated
| Lake | Date | Surface temperature | 1995–2025 average | Difference |
|---|---|---|---|---|
| Lake Superior | 14.37 °C | 13.51 °C | +0.86 °C | |
| Lake Michigan | 18.01 °C | 17.74 °C | +0.27 °C | |
| Lake Huron | 17.19 °C | 16.99 °C | +0.20 °C | |
| Lake Erie | 19.95 °C | 20.11 °C | -0.16 °C | |
| Lake Ontario | 18.87 °C | 18.54 °C | +0.33 °C |
Lakewide satellite-derived averages smooth over large local differences. Nearshore water, beaches and harbors can be much warmer or colder than the lake average.
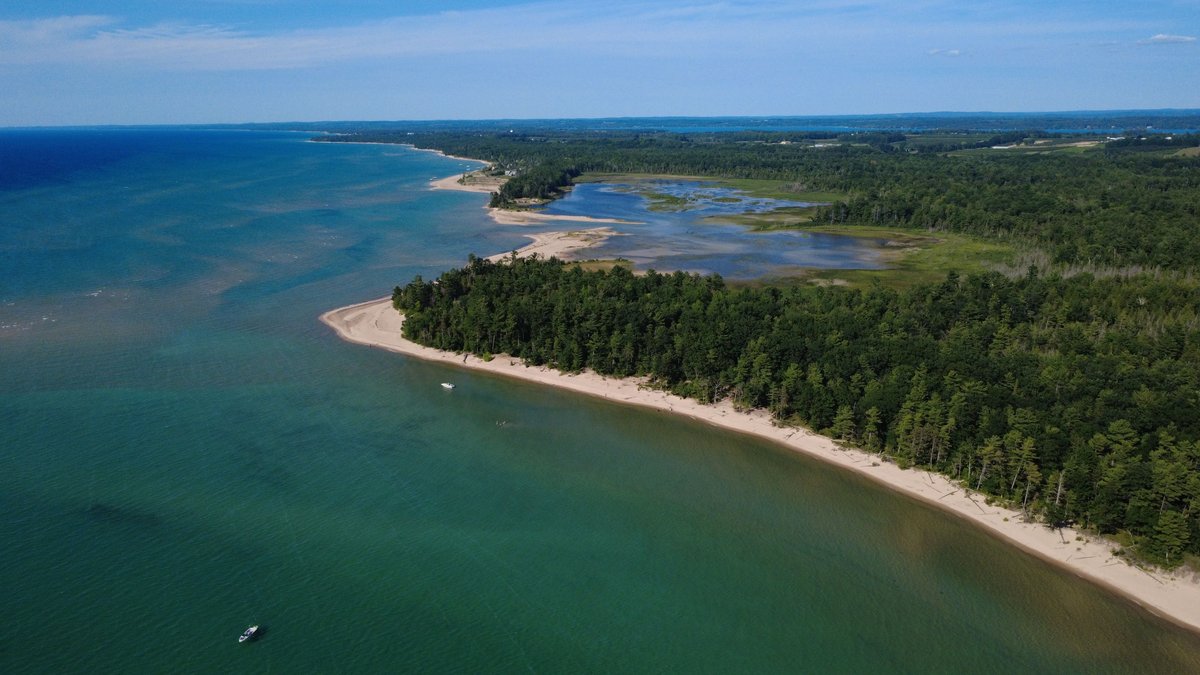
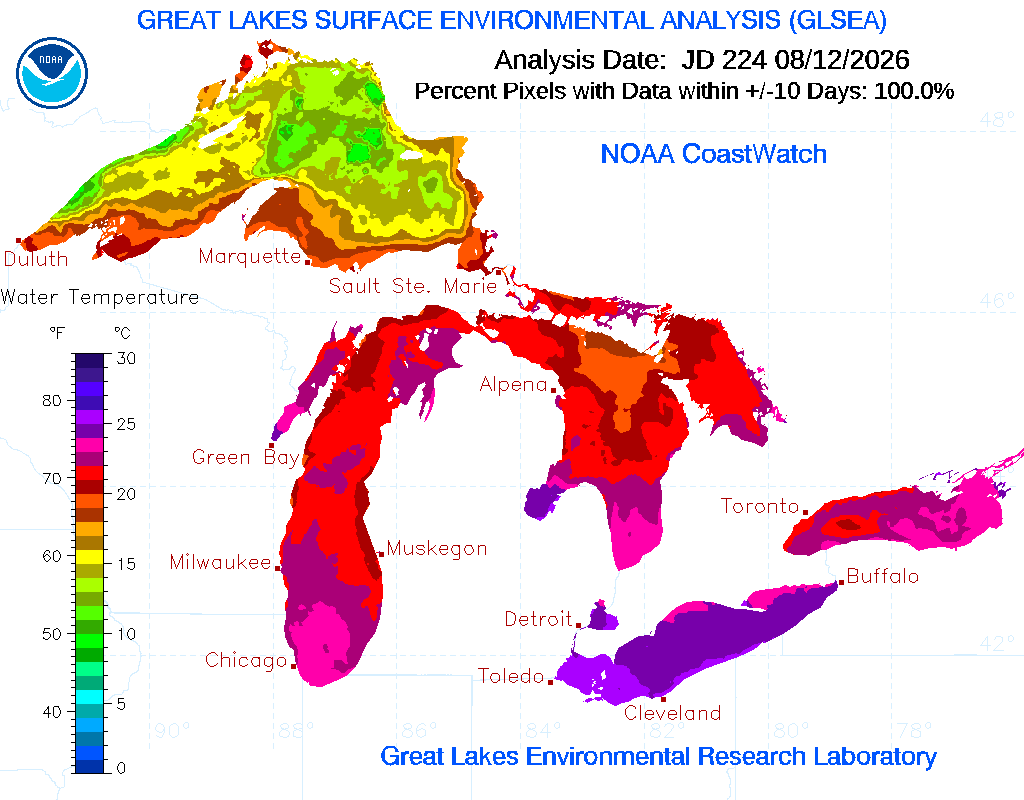
The Great Lakes hold roughly one-fifth of the world’s surface fresh water. Their size creates ocean-like weather and strong local contrasts. This page shows NOAA’s current Great Lakes Surface Environmental Analysis map and the latest lakewide average surface temperature for Superior, Michigan, Huron, Erie and Ontario.
What the GLSEA map shows
The Great Lakes Surface Environmental Analysis, or GLSEA, is a daily gridded analysis of surface water temperature and ice cover. NOAA combines satellite observations with ice information to provide a coherent view across all five lakes. The map’s embedded legend is the key for interpreting its colours.
Clouds can hide the surface from infrared satellites. A daily analysis therefore may incorporate observations from different times and use processing to fill spatial gaps. It should be read as a regional analysis, not a thermometer reading for every beach.
Lakewide averages
The table reports the spatial average across each lake. It also compares the current value with NOAA’s 1995–2025 average for the same day of the year. The difference is calculated by ARGO.net from those two values and is rounded to hundredths of a degree Celsius.
Lake Erie often warms and cools faster than Lake Superior because it is shallower. Deep water stores heat and creates a long seasonal lag, so each lake follows its own cycle. Comparing the five averages is useful, but depth, area, currents and latitude must be kept in mind.
Why local water can be different
Nearshore water can change rapidly with wind. Upwelling may bring cold deep water to a coast; downwelling can push warm surface water shoreward. Bays and shallow beaches may warm far above the lakewide average. River inflow, currents and harbor structures add further variation.
For swimming, boating or fisheries decisions, use local observations and official forecasts. A lakewide mean cannot reveal rip currents, waves, harmful algal blooms, hypoxia or beach closures.
Ice cover
In winter, GLSEA incorporates Great Lakes ice concentration information. Ice affects heat exchange, navigation and lake-effect weather, but ice cover can shift rapidly with wind. During ice-free periods the map is primarily a surface-temperature product.
Methodology and source
The map and daily averages come from NOAA Great Lakes Environmental Research Laboratory CoastWatch GLSEA and its average surface water temperature statistics. NOAA describes GLSEA as a daily product based on multiple satellite sensors, with ice concentration supplied by the National Ice Center.
ARGO.net retrieves the five current-year CSV files and the current GLSEA PNG on a schedule. A new snapshot is published only after the files have the expected year, day-of-year structure and plausible temperatures. The map is copied to ARGO.net’s server so page visitors do not depend on the NOAA image host.
Limitations
- Lakewide averages conceal large nearshore and depth-related differences.
- Satellite coverage and cloud conditions influence the daily analysis.
- The long-term comparison period is stated explicitly and may change in future NOAA files.
- The page is not a boating, beach-safety, ice-travel or harmful-algal-bloom forecast.
Update log
- August 2026: Page launched with the daily GLSEA map and five lakewide temperature comparisons.
Current readings are easier to interpret alongside the seasonal processes behind Lake Superior in winter and Argo’s explanation of how lakes can flood.
Longer-term context appears in Argo’s guides to Lake Ontario water levels and forecasts and Lake Erie water levels and forecasts.





