
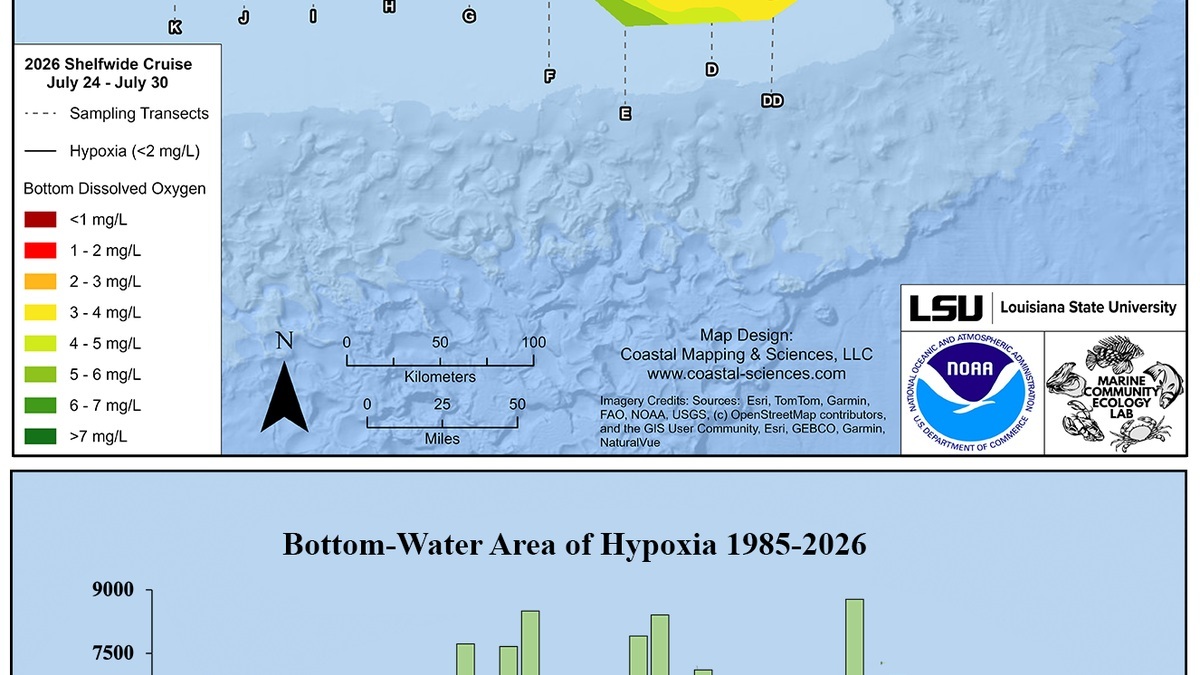
An ocean dead zone is an area where dissolved oxygen falls so low that most animals cannot remain there. Scientists call the condition hypoxia, often using a threshold near 2 milligrams of oxygen per liter for coastal monitoring. Mobile fish may leave, while bottom-dwelling animals can suffocate. “Dead” is a vivid shorthand; microbes and some tolerant organisms may persist.
NOAA’s dead zone definition identifies nutrient pollution as the main driver of human-enhanced coastal zones. Excess nitrogen and phosphorus fuel algal growth. When algae die, bacteria decompose the organic matter and consume oxygen. Weak mixing can then keep oxygen-rich surface water from replenishing deeper layers.
How a dead zone forms
Nutrients are essential ingredients of marine food webs. Trouble begins when rivers, runoff, wastewater, or atmospheric deposition deliver more than an ecosystem can process. Phytoplankton respond with increased growth. Their biomass eventually sinks, providing abundant food for bacteria in deeper water and sediment.
Bacterial respiration uses dissolved oxygen while breaking organic matter down. In well-mixed water, oxygen from the atmosphere and photosynthesis can replace much of the loss. Stratification creates a barrier. Warm fresh water often floats above cooler, saltier water, limiting vertical exchange and allowing bottom oxygen to decline.
The chain is commonly called eutrophication: nutrient enrichment increases production, decomposition raises oxygen demand and restricted circulation prevents recovery. Each link influences severity. A large nutrient load may have modest effects in a rapidly flushed coast, while a sheltered, layered bay can become hypoxic under a smaller load.
Natural processes can also create low-oxygen waters. Some basins exchange water slowly and productive upwelling systems generate abundant organic matter. Human nutrient inputs have increased the frequency or extent of hypoxia in many shallow coastal and estuarine areas. Identifying the human contribution requires long-term records and watershed data.
Oxygen can fall along a gradient rather than at a sharp edge. The upper boundary may rise at night when photosynthesis stops, then sink after daylight returns. Near the bottom, sediment microbes add another demand. Sensors placed at several depths reveal these cycles and keep a brief surface reading from being mistaken for conditions throughout the water column. Salinity and temperature profiles show whether density layering is blocking oxygen replacement. Current measurements then reveal whether low-oxygen water is forming locally or arriving from elsewhere.
What low oxygen does to marine life
Fish, shrimp and crabs often move away as oxygen falls, compressing their usable habitat into shallower or better-ventilated water. Escape costs energy and can alter feeding, predator exposure and catches. A zone without fish may still contain bacteria, jellyfish, or tolerant worms, so biological response varies across species and oxygen levels.
Animals attached to the bottom or buried in sediment have fewer options. Oysters and other immobile organisms may close their shells temporarily, but prolonged hypoxia can kill them. Eggs and larvae can be especially vulnerable. Complete oxygen loss, called anoxia, also changes sediment chemistry and may release compounds harmful to many animals.
Repeated events can simplify bottom communities. Long-lived, sensitive species disappear, while small, fast-reproducing organisms return first after oxygen recovers. Food webs and nutrient cycling change along with the community. Fisheries effects may extend beyond visible kills because animals avoid habitat and growth can slow under sublethal exposure.
Low oxygen can also compress predators and prey into the same remaining habitat. The crowding may briefly increase catches along a zone’s edge without indicating a healthier fishery. If suitable habitat stays small, competition and stress can increase. Catch data therefore need oxygen maps and effort records before they are used to infer population change.
Hypoxia does not automatically mean a toxic algal bloom. Both can follow nutrient enrichment, but harmful blooms involve algae or cyanobacteria that create toxins or other damaging effects. A nontoxic bloom can still contribute to low oxygen after decomposition. An area may experience one problem without the other.
Why dead zones often change with the seasons
River flow and rainfall can deliver a pulse of nutrients during spring. Increasing sunlight and warmth support plankton growth, while surface heating strengthens stratification. By summer, decomposition has consumed bottom oxygen and calm weather may limit mixing. Autumn storms or cooling can break down the layers and reoxygenate the water.
The northern Gulf provides a well-studied example. Mississippi and Atchafalaya River discharge supplies nutrients to the continental shelf and seasonal stratification restricts oxygen replacement. NOAA’s hypoxia program supports forecasts and annual surveys that measure the zone rather than relying on forecast size alone.
A dead zone’s boundary can shift within days as winds and currents move water. One research cruise captures a defined period, not every location across an entire season. Scientists therefore compare standardized surveys over many years and combine them with fixed sensors; models help interpret short-term movement.
Climate conditions influence the process. Warmer water holds less oxygen and stronger stratification can reduce ventilation. Changing rainfall alters nutrient delivery, while sea-level and circulation changes affect coastal exchange. Local outcomes remain region-specific, but warming can intensify oxygen stress where nutrient-driven hypoxia already occurs.
How scientists measure hypoxia
Researchers lower instruments through the water column to measure temperature, salinity, depth and dissolved oxygen. Bottom readings reveal whether an oxygen-poor layer lies beneath healthier surface water. Repeated stations map area and thickness. Calibration and quality control are essential because small sensor errors can change which observations cross a chosen threshold at each station.
Moorings record the rise and fall of oxygen at one location, while autonomous gliders cover broader transects. Ships collect water samples and biological observations. Satellites cannot directly see oxygen at depth, yet they provide surface temperature, color and river-plume information that helps explain conditions affecting the zone.
Forecast models combine nutrient loads, river discharge, weather, circulation and biological oxygen demand. Their predictions help agencies plan surveys and communicate seasonal risk. Measurements remain necessary to test the forecast. NOAA’s National Centers for Environmental Information also compiles a hypoxia watch from fisheries survey observations.
Thresholds should be read with context. Two milligrams per liter is widely used for coastal hypoxia, but some species show stress above it and others tolerate lower concentrations briefly. Duration and temperature influence harm. Scientists often examine the entire oxygen distribution rather than treating one cutoff as a universal biological boundary.
Reducing the conditions that feed dead zones
Prevention focuses on nitrogen and phosphorus throughout the watershed. Farms can match fertilizer timing and amount to crop needs, use cover crops, reduce erosion and protect stream buffers. Cities can improve wastewater treatment and manage stormwater. Restored wetlands can retain or transform some nutrients before they reach coastal water.
EPA’s review of nutrient pollution effects connects excess nutrients, algal growth, decomposition and oxygen loss. The sources are spread across large watersheds, so no single downstream project can address them all. Progress requires coordinated targets and monitoring with practices suited to local soils and waterways.
In-water remedies such as aeration may help small enclosed sites, but they are difficult to scale across a coastal shelf. Restoring circulation can work where a human-made barrier caused stagnation, though construction has other ecological effects. Reducing the upstream nutrient load addresses the driver of many recurring coastal zones.
Recovery can take time because nutrients stored in soil, groundwater, or sediment may continue moving downstream after practices change. Year-to-year weather can mask a long-term trend. Consistent measurements of both nutrient loads and oxygen provide the clearest test of whether management is shrinking the risk and restoring usable habitat.
Related reading: pelagic and benthic zones and abiotic factors in the ocean.





