
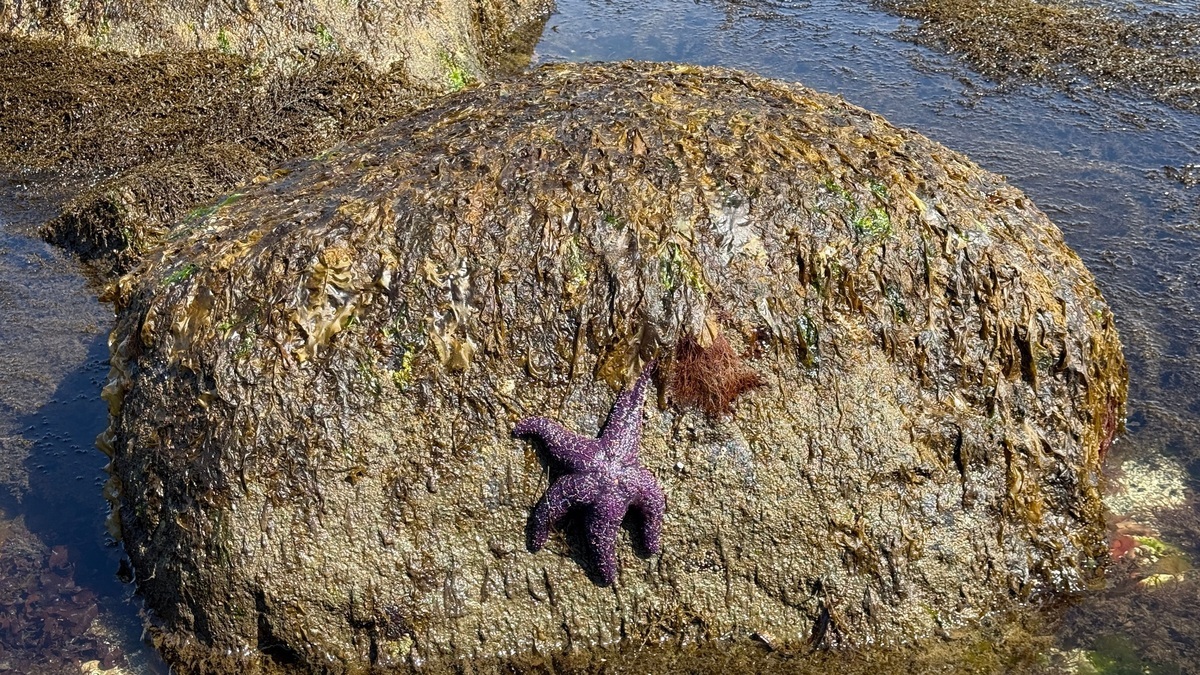
The littoral zone is commonly the intertidal strip covered at high tide and exposed at low tide. The sublittoral zone, also called subtidal, begins below the low-tide line and remains submerged. Terminology varies among marine and freshwater fields, so a study’s definition should be checked.
NOAA describes the intertidal zone as the meeting place of land and sea. Its organisms face repeated air exposure. Sublittoral organisms remain underwater but still experience waves, light and coastal currents.
Tides create the littoral rhythm
Water level rises and falls with astronomical tides, then weather modifies the prediction. The upper shore spends long periods dry, while lower intertidal ground is exposed only around low tide.
Desiccation, temperature swings and changing salinity test organisms during exposure. Barnacles close their plates, mussels clamp shells and mobile animals shelter in cracks or pools.
Wave splash extends marine influence above the normal high-tide line. Local exposure therefore depends on shore slope and wave energy as well as the tide table.
Sediment grain size changes the expression of the boundary. On a sandy beach, waves continually move the surface and many animals remain buried. A rocky shore preserves stable attachment points and visible bands. Mudflats drain slowly, leaving water films and channels that soften the transition from exposed to submerged habitat.
Freshwater input can make estuarine littoral conditions especially variable. Rain and river flow lower salinity during one low tide, then incoming seawater raises it hours later. Sublittoral channels often retain saltier bottom water. Organisms survive through physiological tolerance, movement or burrowing into more stable sediment.
The sublittoral stays wet but remains demanding
Permanent submergence removes the drying cycle. Competition, grazing and predation can intensify because aquatic predators remain active through the tide.
Light supports kelp, seagrass and attached algae in shallow clear water. Turbidity or depth sets the lower limit of plant growth, so the sublittoral extends below the vegetated band.
Sand, rock and mud create different habitats. Burrowers dominate shifting sediment, while reefs provide attachment surfaces and crevices.
The lower limit of the sublittoral is defined differently among classification systems. Some extend it only across the continental shelf, while vegetation studies end the zone where rooted plants or attached algae lose sufficient light. A map must identify the chosen criterion instead of presenting one depth as universal.
Larval supply links the zones. Many intertidal barnacles and mussels spend an early stage drifting in sublittoral water before returning to the shore. Currents, spawning timing and settlement cues determine which exposed patches receive recruits, so adult abundance can change even when local rock conditions remain stable.
Zonation appears clearly on rocky shores
Rocky coasts often show horizontal bands of lichens, barnacles, mussels and algae. Each band reflects tolerance of drying plus interactions with competitors and consumers.
Removing a predator can let prey occupy more space, while removing a canopy species changes shade and moisture beneath it. Physical tolerance alone does not determine every boundary.
Tide pools preserve water during low tide but can heat, cool or become saltier quickly. They act as submerged islands inside the exposed littoral landscape.
Human access differs sharply. Walking, harvesting and shoreline construction directly affect the littoral band, while anchors, dredges and fishing gear disturb sublittoral bottom. Pollution and warming cross both. Effective monitoring follows a pressure from its source rather than stopping at the low-tide line.
Wave exposure changes body form and attachment. Mussels bind to rock with byssal threads, limpets clamp broad feet against the surface and kelp holdfasts grip sublittoral reef. Sheltered sites favor different shapes and competitors. Comparing shores requires an exposure measure because tidal elevation alone cannot represent the force organisms experience.
Storms move both boundaries
Waves detach organisms and roll sediment. A storm can strip a rocky patch, bury seagrass or open new space for colonization.
Storm surge raises water above predicted tides. Argo’s comparison of storm surge and storm tide explains how weather changes coastal water level.
Sea-level rise gradually shifts tidal elevations landward where development does not block migration. Armored shorelines can squeeze intertidal habitat between rising water and fixed structures.
On soft shores, oxygen often falls within the first centimeters of sediment. Burrowing worms irrigate their tunnels and create oxidized halos, while sulfide accumulates deeper. Low tide changes drainage and gas exchange in the littoral flat; permanently submerged sediment follows a steadier cycle controlled by bottom-water oxygen and animal mixing.
NOAA’s tide tutorial separates the astronomical cycle from weather-driven water levels. The distinction is essential after a storm because prolonged flooding can keep an ordinarily littoral surface underwater, while wave run-up reaches above the predicted high tide.
Researchers measure exposure and community
Permanent transects cross the shore from high littoral to sublittoral. Repeated quadrats record cover, abundance and recruitment. Temperature loggers reveal extremes missed by monthly visits.
Divers and remotely operated cameras continue the survey below low tide. Wave sensors and bathymetry connect species patterns with physical stress.
Comparisons need a shared tidal datum because the visible waterline moves each hour. Elevation relative to mean lower low water is more reproducible than distance from today’s surf.
Estuaries add salinity to the survey design. NOAA’s estuary tutorial describes the mixing of river water with seawater. Sampling across the same tidal elevation at ebb and flood reveals whether an apparent zone difference reflects a passing freshwater plume.
Permanent photo quadrats record slow shifts in cover, while temperature loggers capture short heat spikes. Divers can extend the same transect into sublittoral habitat. Using a consistent image area and tidal datum lets researchers compare exposed and submerged plots without confusing field method with ecology.
The useful distinction is time underwater
Littoral organisms alternate between marine immersion and aerial exposure. Sublittoral organisms remain submerged, though the shallowest still endure turbulence and rapid change.
Intertidal versus subtidal is clearer than treating both as vague nearshore water. It predicts drying stress, access by predators and the tools required for fieldwork.
The two habitats exchange larvae, food and mobile animals. Their boundary organizes coastal ecology without separating the shore into independent systems.
A boundary that migrates during every tide
The low-tide line is a moving intersection between a sloping shore and changing water level. Spring tides expose more of the lower shore than neap tides, while wind and atmospheric pressure add short-term departures. A fixed marker can spend one day submerged and another briefly exposed without the habitat classification itself being inconsistent.
Ecologists often describe upper, middle and lower intertidal bands because exposure time changes gradually. The shallow sublittoral begins below them, but waves still connect its organisms with the shore. Reporting tidal elevation and observation time lets another researcher reconstruct where a sample sat within that moving gradient.
Photography taken at a fixed tidal elevation helps separate real community change from a change in survey timing. Divers can extend the same transect below low water, but image scale and visibility must match shore observations. Permanent markers allow researchers to revisit individual patches after heat waves, storms or recruitment events. Matching the observations to wave records and verified tidal elevations helps identify whether lost cover followed physical removal, thermal stress or poor settlement. Recovery can then be measured at the same places through successive seasons. Paired temperature loggers above and below the low-water line reveal how quickly aerial exposure changes conditions. The submerged logger provides a local baseline, while the exposed instrument records heating or cooling that organisms actually endured. Salinity sensors add context where rain or river discharge changes the shore between visits.
Place these coastal seafloor bands in a wider framework with the pelagic-benthic comparison and Argo’s guide to the continental shelf.





