
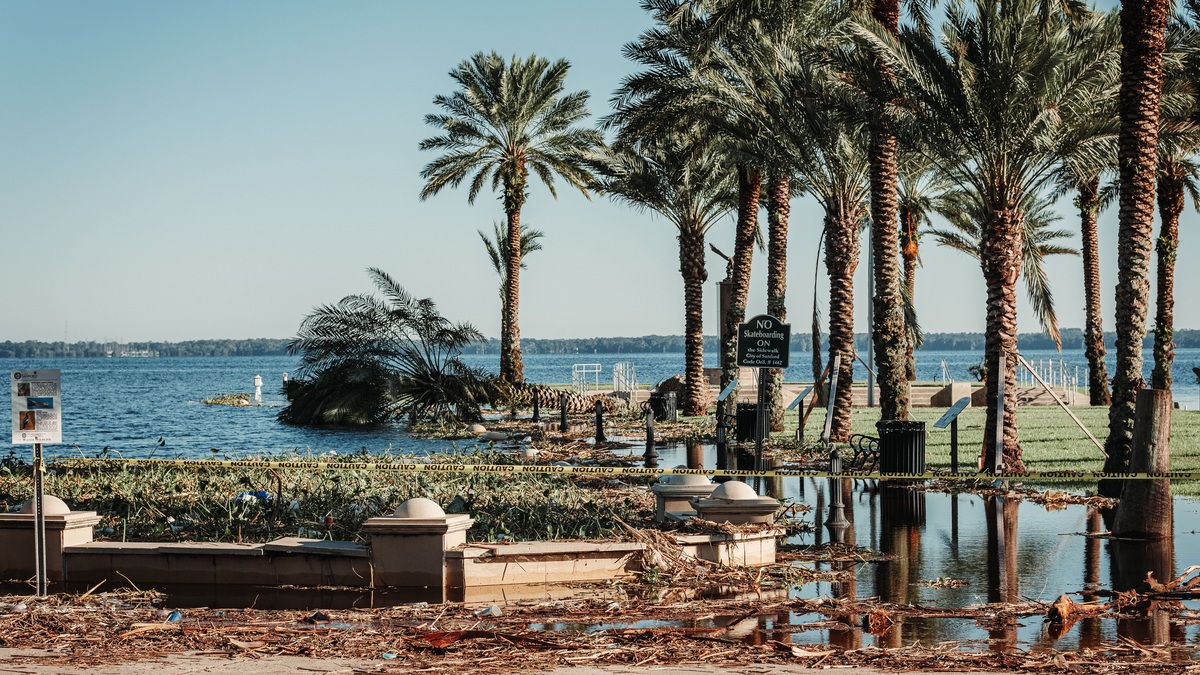
Storm surge is the abnormal rise of seawater produced by a storm above the predicted astronomical tide. Storm tide is the total water level resulting from the combination of storm surge and the astronomical tide. Waves can rise above both measurements and drive water farther inland.
The distinction separates the storm’s contribution from the water level people actually experience along the coast. A six-foot surge arriving near a two-foot astronomical high tide can contribute to a storm tide near eight feet, although local water-level components and the reference datum used in a forecast must also be considered.
Storm surge isolates the weather signal
Strong onshore winds push surface water toward land. As the water reaches shallower coastal areas, it cannot continue downward, so it piles against the shore and flows into bays or rivers. This wind-driven accumulation usually provides the largest part of tropical-cyclone storm surge.
Atmospheric pressure also contributes. Lower pressure allows the sea surface to rise, but the direct pressure effect is often smaller than wind forcing in a major hurricane. The National Hurricane Center’s storm-surge overview defines surge relative to the predicted astronomical tide.
Measuring surge as a residual helps forecasters compare storms arriving at different points in the tidal cycle. Tide gauges record the actual water level. Analysts subtract the predicted astronomical tide to estimate how much of the departure came from the storm and other non-tidal effects.
Storm tide describes the combined water level
Coastal flooding depends on how high the water reaches, so the astronomical tide cannot be ignored. If surge arrives around high tide, the combined storm tide is higher. The same surge arriving near low tide starts from a lower baseline and may produce less inundation.
NOAA’s illustrated comparison of storm surge and storm tide shows predicted high tide, the storm-driven rise and the combined observed level. Forecast products may use slightly different datums, so users should read the map legend rather than comparing numbers without their reference level.
Storm tide can include regional sea-level departures in addition to the astronomical tide and surge. River discharge may elevate water in an estuary, while a long-lived wind pattern may raise coastal water before the cyclone arrives. The observed peak reflects the combined coastal system.
The timing of the surge peak may differ from landfall. Water can rise early in a bay or remain elevated after the storm center moves inland. A forecast for one shoreline segment should not be transferred to another because wind direction and local geography change rapidly around a cyclone.
Waves sit on top of the storm tide
Neither surge nor storm tide includes the full height of individual wind-driven waves. Breaking waves add brief peaks above the elevated water level. They can batter structures, cross dunes and carry debris into areas already flooded by the underlying storm tide.
Wave setup can also raise the average water level near the shoreline. Runup describes how far a breaking wave rushes up a beach or structure. These processes help explain why damage at an exposed coast can exceed what a still-water inundation number alone seems to imply.
The National Hurricane Center’s training material separates surge, storm tide and inundation. Inundation is the depth of water over normally dry ground. A ten-foot storm tide referenced to a vertical datum does not automatically mean ten feet of water inside every building.
Storm size and track control the surge
A broad storm can push water over a much larger area and for a longer time than a compact cyclone with the same maximum wind speed. Forward speed changes how long winds act on the coast. The angle of approach determines which locations face the strongest onshore component.
Coastline shape can funnel water into bays. A wide, gently sloping continental shelf allows water to accumulate over a large shallow area and often favors a higher surge. A narrow, steep shelf may produce a lower surge but larger breaking waves close to shore.
The storm’s strongest winds are not distributed evenly. In the Northern Hemisphere, the right side of a moving tropical cyclone often combines forward motion with rotating winds, but local surge still depends on the track and coastline orientation. Forecast maps resolve this spatial variability better than a single category-based estimate.
Hurricane category describes maximum sustained wind, not surge at every point. A lower-category but very large storm can generate severe coastal flooding. Relying on category alone can hide the water hazard that evacuation zones are designed to address.
Tide predictions and surge forecasts answer different questions
A tide prediction estimates the astronomical rise and fall based on long observations and known cycles of the Moon and Sun. A surge forecast uses storm wind, pressure, track and ocean models. Combining them gives a forecast of total water level or inundation.
NOAA’s Tides and Currents network lets users compare predicted and observed water levels. The gap between the curves during a storm reveals the non-tidal residual in real time, although preliminary observations may later receive quality control.
Argo’s coastal water-level overview links astronomical conditions with current observations. Emergency decisions should still follow official local forecasts and evacuation instructions because a regional page cannot capture street-level exposure.
The practical difference is simple
Surge answers how much the storm raised the sea above its predicted tide. Storm tide answers how high the combined still-water level became relative to the stated datum. Inundation answers how deep that water may be over land, while waves describe additional motion on top.
Keeping the terms separate improves comparisons and reduces false reassurance. A modest surge can be dangerous at high tide and a large surge can remain catastrophic even if it peaks near low tide. The safest response is to use the forecast product built for the local hazard rather than estimating total water from one number.
Maps use datums and probabilities
A surge value needs a vertical reference. Forecasts may show height above ground, above a tidal datum or above a standard elevation reference. Two maps can display different numbers for the same physical water level when their datums differ.
Probabilistic surge products run many plausible storm tracks and intensities. They estimate the chance that water will exceed a level rather than declaring one exact outcome. This approach represents forecast uncertainty while there is still time for protective action.
Potential storm-surge flooding maps often exclude wave action and rainfall flooding. A location outside a surge zone can still experience flash flooding, river flooding or dangerous surf. Each hazard requires its own official map and instructions.
Argo’s explanation of ocean conditions provides context for waves and coastal observations. During a named storm, National Hurricane Center advisories and local emergency management orders are the authoritative sources for decisions.
Why evacuation zones extend beyond one number
Elevation above sea level is only part of exposure. Roads can be cut off before a building floods and moving water can undermine foundations or carry debris. Evacuation zones account for access and regional modeling rather than merely drawing a contour around the lowest land.
Forecast confidence changes as the storm approaches. Early maps cover a wider range of possible tracks, while later guidance may narrow the most likely corridor. Waiting for an exact number can leave too little time to move through traffic or prepare a property safely.
After landfall, observed storm tide helps engineers compare the event with forecasts and design standards. High-water marks extend the record beyond tide gauges, which may fail or sit outside the deepest inundation. Those surveys document the combined result even when individual surge components must be reconstructed.





