
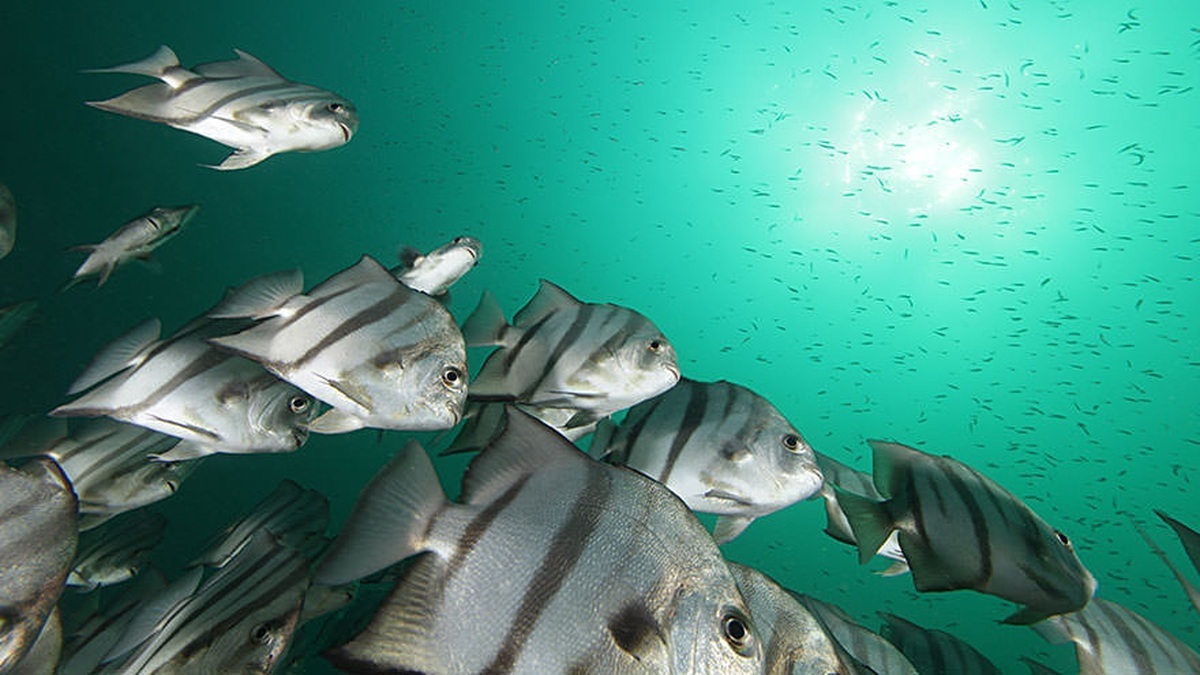
Scientists count marine life by combining direct surveys, catches, cameras, acoustic instruments, environmental DNA, tags and statistical models. No method observes every organism. A reliable census estimates the portion missed and matches the tool to the species, habitat and question.
NOAA’s overview of the marine census points to the international Census of Marine Life, which documented diversity, distribution and abundance across a decade. Modern programs continue that work through standardized monitoring and shared databases.
A count is usually an estimate. Detectability changes with depth, weather, animal behavior and equipment, so raw sightings rarely equal total population size.
Visual surveys estimate imperfect detection
Divers, ships and aircraft record organisms within transects or fixed plots. Distance sampling uses how far detections occur from the survey line to estimate animals observers missed.
Underwater cameras extend observation into deep or hazardous habitat. Baited systems attract mobile scavengers, while unbaited video records less altered behavior. Each introduces a different sampling bias.
Photo identification follows distinctive whales, sharks or rays across time. Mark-recapture models use repeated encounters to estimate abundance and survival.
Nets and traps sample hidden organisms
The NOAA Fisheries survey overview describes standardized ship surveys supporting stock assessment.
Plankton nets collect tiny drifting organisms from a measured volume of water. Trawls sample fish and bottom animals over a known distance, while traps target species entering voluntarily.
Gear selectivity shapes results. Mesh size, towing speed and animal behavior determine what is retained or escapes. Repeating protocols makes trends comparable even when no gear captures the whole community.
Researchers identify specimens, measure body size and sometimes archive tissue. Physical samples support age studies, genetics and verification that images or acoustic signals cannot provide.
Sound covers areas beyond human sight
Active sonar sends pulses and interprets echoes from fish schools or layers of plankton. Calibration connects echo strength with organism density, though species identification may require catches or optical confirmation.
Passive acoustic monitoring records sounds made by whales, fish and other animals. Calling rate must be known before detections can become an abundance estimate.
The NOAA CalCOFI program illustrates long-term integration of ocean conditions, plankton and fish observations.
Quiet animals remain invisible to passive systems, while seabed and bubbles complicate active acoustics. Multiple instruments reduce ambiguity.
Animals shed cells, mucus and waste containing DNA. Researchers collect water, extract genetic material and compare sequences with reference libraries.
Environmental DNA detects genetic traces
Metabarcoding can detect many groups in one sample. Species-specific assays search sensitively for one target, including rare or invasive organisms.
Detection does not equal a body count. DNA production, transport and degradation vary. A positive result shows genetic material was present, not necessarily how many living animals occupied the exact sampling point.
The USGS eDNA program explains applications and quality controls.
Occupancy models estimate the probability a species is present while accounting for imperfect detection. Stock assessments combine catches, biological samples and survey indices to estimate fish population status.
Models combine observations and uncertainty
Habitat models extend sampled relationships into unsurveyed areas. Their predictions are strongest within environments represented by the data and must be tested with new observations.
Standardization makes trends credible. Changing gear, season or survey route can imitate biological change. Calibration studies connect old and new methods when upgrades are necessary.
Taxonomy is a counting technology. Specimens that appear identical may represent several cryptic species, while juveniles can look unlike adults. Morphology, genetics and life-history evidence establish what unit is being counted.
Complementary evidence builds a marine census
Reference collections preserve verified specimens and allow identifications to be revisited. DNA libraries are only as reliable as the names attached to their source material.
Microbes require different methods. Sequencing detects organisms that cannot be cultured, while microscopy and flow cytometry count cells. Gene copy number and extraction efficiency complicate conversion from sequences to abundance.
Deep-sea exploration often discovers species from only a few observations. Scientists can document diversity without claiming a global population estimate unsupported by sparse sampling.
Random sampling prevents crews from choosing only convenient or species-rich sites. Stratification allocates effort among depths, habitats or regions with different variability.
Repeated surveys reveal trends
Power analysis estimates how many samples are needed to detect a meaningful trend. Rare species often require wider coverage or targeted methods.
Pilot studies reveal equipment failures and realistic detection rates. Adjustments made before long-term monitoring preserve comparability later.
Replication separates pattern from chance. Multiple independent samples are more informative than repeated measurements of one location.
Rarefaction curves compare diversity among samples with different effort. They indicate whether additional sampling is likely to reveal many more taxa.
Occupancy and abundance answer different questions. A species can spread into more sites while declining in density, or concentrate locally without expanding its range.
Survey design begins before fieldwork
Marine censuses also document non-native species early. Confirmed identification and rapid reporting give managers more options before a population becomes widespread.
For exploited species, fishery-independent surveys prevent commercial effort from being confused with abundance. Catch can rise because vessels improve even while a stock declines.
For protected wildlife, permits and noninvasive methods reduce survey harm. Study design weighs the information gained against disturbance to animals or habitat.
Quality assurance includes duplicate samples, blank controls and calibration records. Errors found early can be corrected before they spread through a database.
Taxonomy defines what scientists count
Automated image classifiers assign probabilities rather than unquestionable names. Reviewing uncertain cases improves training data and prevents common species from overwhelming rare detections.
A useful census remains updateable. New observations revise distributions and taxonomic changes revise names without erasing the original evidence.
A local density estimate cannot be multiplied across an ocean without suitable habitat information. Extrapolation follows the sampled population and spatial frame.
Management requires the correct spatial scale
Management may need biomass, breeding adults or occupancy rather than total individuals. The metric should match the ecological question.
Detection changes after storms, algal blooms or instrument upgrades. Analysts test these alternatives before calling a shift biological.
Transparent methods build trust. Publishing protocols, code and uncertainty allows agencies to compare evidence and revise conclusions when better data arrive.
Seasonal migration can make abundance at one site rise or fall without a population change. Surveys return at consistent times or explicitly model seasonal movement.
Long time series establish changing baselines
Long time series reveal baselines. They capture unusual recruitment years, marine heat waves and gradual shifts that a short project cannot distinguish.
Historical logbooks, museum specimens and fisheries records extend context but were collected for different purposes. Researchers account for changes in effort and identification.
Uncertainty intervals communicate the precision of an estimate. Wider intervals are not failure; they prevent weak data from appearing more certain than they are.
Open data improve synthesis when formats, coordinates and sampling methods are documented. Sensitive locations may still need protection to prevent harm to rare species.
A marine census is strongest when another team can understand how, when and where observations were made. Reproducibility transforms scattered encounters into evidence about changing ocean life.
Global databases remain uneven
Global databases help researchers map known records, but collection effort is uneven. Coastal, shallow and commercially valuable species are usually better documented than deep or microscopic life.
Autonomous vehicles and machine learning expand coverage. Human experts still validate classifications, investigate errors and decide whether a statistical difference is ecologically meaningful.
Scientists count marine life most effectively by designing a survey around a clear question, measuring detection and reporting uncertainty. The resulting estimate is more useful than a precise-looking total that ignores everything the method could not observe.
Survey archives also preserve negative results, which prevent later researchers from mistaking unsampled water for places where a species was carefully sought but not detected.
Related reading: ocean gliders and marine biogeography.





