El Niño and La Niña Tracker

NOAA’s current ENSO assessment, ocean indicators, probabilities, methodology, and what El Niño or La Niña can—and cannot—predict.

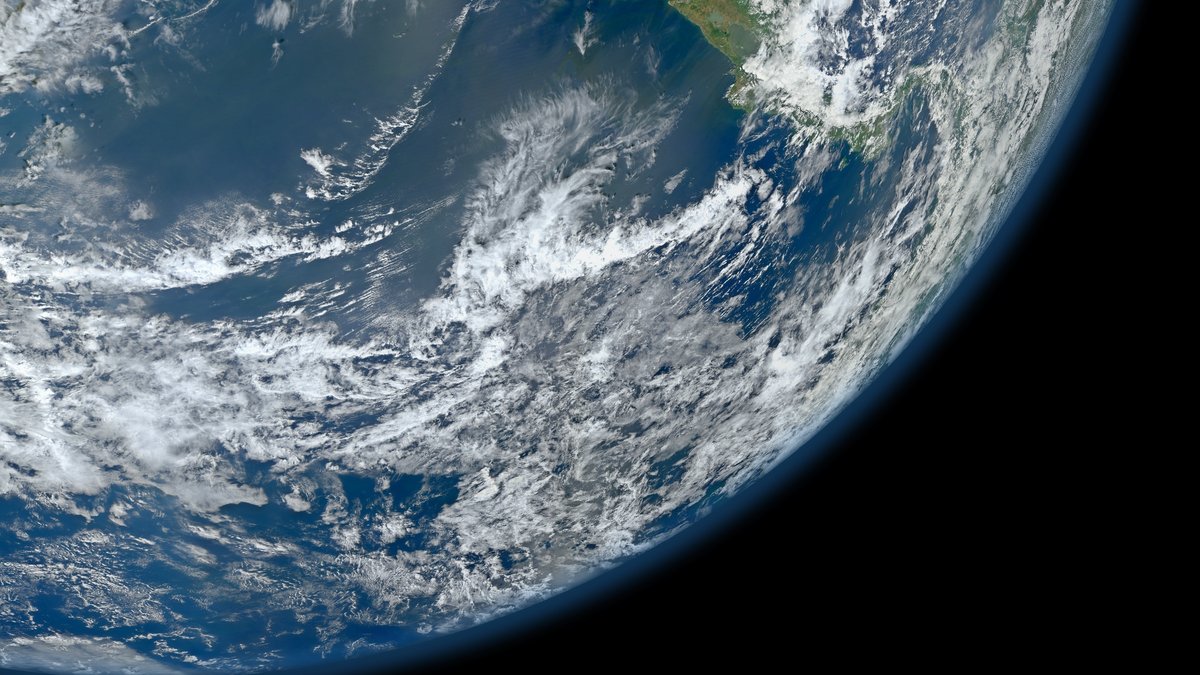
Pacific Ocean seen from space by the Suomi NPP satellite
The Pacific Ocean viewed by the Suomi NPP satellite. Image: NASA/NOAA/GSFC/Suomi NPP/VIIRS/Norman Kuring.

Preferred Source

Follow ARGO.net Science on Google to see more of our stories in Search.

Follow on Google
TrackerReview schedule: Monthly
Updated

Current status, verified July 29, 2026: an El Niño Advisory is in effect. NOAA’s Climate Prediction Center said on July 9 that El Niño was continuing and strengthening. Its latest weekly relative Niño-3.4 value was +1.2°C. NOAA assigned a 97% chance that El Niño will persist through early Northern Hemisphere spring 2027 and an 81% chance of a very strong event during October–December 2026.

Those figures come directly from the NOAA Climate Prediction Center’s July 2026 ENSO Diagnostic Discussion. The next scheduled monthly discussion is August 13, 2026. Forecast probabilities describe the range of plausible future states; they do not guarantee a particular strength or a particular weather outcome in any location.

ENSO status board

Official NOAA indicators and forecast information available on July 29, 2026
Indicator Latest value or status What it means Official source
ENSO Alert System El Niño Advisory Coupled ocean and atmosphere observations show an El Niño event in progress. NOAA CPC, issued July 9, 2026
Weekly relative Niño-3.4 +1.2°C The central-equatorial Pacific monitoring region was substantially warmer than the tropical background. NOAA ENSO Diagnostic Discussion and figures
Niño-4 +0.5°C Warm conditions extended into the western monitoring region. NOAA CPC, July 9, 2026
Niño-1+2 +2.7°C Very large warmth was present in the far-eastern equatorial Pacific near South America. NOAA CPC, July 9, 2026
Persistence forecast 97% through early spring 2027 Forecasters express very high confidence that El Niño will continue through that period. NOAA CPC official forecast
Very strong event forecast 81% in October–December 2026 A high probability, but not certainty, that the seasonal relative Niño-3.4 measure reaches NOAA’s very-strong category. NOAA CPC strength probabilities
Next scheduled update August 13, 2026 ARGO.net will reassess the alert, observations and probabilities after NOAA publishes. NOAA CPC update schedule

Why NOAA calls this El Niño

El Niño–Southern Oscillation, or ENSO, is a coupled ocean-atmosphere pattern in the tropical Pacific. El Niño is its warm phase, La Niña its cool phase, and ENSO-neutral the state in which neither phase is established. Temperature alone is not the whole event. Forecasters look for a sustained change in the central-equatorial Pacific together with atmospheric responses such as altered trade winds, pressure and tropical rainfall.

NOAA’s July diagnosis found that both halves of the system were behaving consistently with El Niño. Surface temperatures were warm across a large part of the central and eastern equatorial Pacific. A downwelling Kelvin wave deepened the thermocline and increased subsurface warmth in the east. Low-level winds were anomalously westerly across the western and central equatorial Pacific, while convection increased farther east and was suppressed over Indonesia. The traditional and equatorial Southern Oscillation indices were significantly negative. Taken together, NOAA said these signals reflected a strengthening, coupled El Niño.

What is the relative Niño index?

In February 2026, the Climate Prediction Center announced that it was adopting the Relative Oceanic Niño Index, or RONI, for operational monitoring and historical classification. The change matters because the entire tropical ocean has warmed over time. A conventional anomaly compares Niño-3.4 temperatures with a fixed climatological baseline; RONI additionally subtracts the average tropical sea-surface temperature anomaly, then rescales the result to retain comparable variability. NOAA says this makes monitoring more responsive and less dependent on a lagging base period. The agency explains the change in its official RONI announcement.

RONI is the three-month running mean of relative sea-surface temperature anomalies in the Niño-3.4 region, spanning 5° north to 5° south and 170° west to 120° west. NOAA identifies warm and cool periods using thresholds of at least +0.5°C or at most −0.5°C for five consecutive overlapping three-month seasons, while also examining whether the atmosphere is coupled to the ocean. The complete NOAA RONI table and methodology extends from 1950 to the present.

The weekly +1.2°C number in the status board is a fast observation, not itself the final seasonal classification. Weekly measurements can jump because of weather and other short-lived variability. Historical episodes are classified from overlapping three-month averages, and NOAA warns that the newest RONI estimates can change for up to two months as data processing is completed.

What could happen next?

NOAA expects El Niño to intensify through the end of 2026. Model guidance and the observed ocean-atmosphere coupling support the 97% persistence probability through early spring 2027. The forecast also gives an 81% probability of a very strong event in October–December. That would place the event among the largest in the relative-index record beginning in 1950 if the threshold is reached in observations.

Forecast language must remain probabilistic. An 81% chance leaves a 19% chance that the very-strong threshold is not reached. Forecasts can also change as new observations enter the models. ARGO.net will preserve the probability and issue date together rather than presenting an old forecast as though it were a current fact.

What El Niño does—and does not—tell us

ENSO changes the odds of seasonal weather patterns by reorganizing tropical Pacific heat and rainfall and influencing atmospheric circulation farther away. A stronger event can exert a larger influence, but it does not dictate weather at every place or time. NOAA explicitly cautions that even the strongest El Niño events do not produce their typical impact everywhere. Other ocean patterns, atmospheric variability and local conditions remain important.

For that reason, this tracker does not translate the global ENSO status into deterministic claims such as “your winter will be wet” or “a particular storm was caused by El Niño.” Local seasonal outlooks express probabilities for temperature and precipitation and are the appropriate source for regional planning. Readers in the United States can consult the official CPC seasonal outlooks. National meteorological agencies should be used elsewhere.

El Niño is also a natural climate pattern, not a synonym for global warming. Long-term human-caused warming changes the background climate in which ENSO occurs, while ENSO temporarily redistributes heat between the ocean and atmosphere. The move to RONI is intended to make the index more reliable as the tropical background changes; it does not remove the need to evaluate long-term climate trends separately.

Tracker methodology

The status headline follows NOAA CPC’s monthly diagnostic discussion. Each monthly revision records the advisory category, relative Niño-region observations, official persistence probability, any published strength probability, and the date of the next discussion. Weekly values may be checked between monthly releases, but ARGO.net will not declare or end an ENSO event independently of the official coupled-system diagnosis.

Values are transcribed with their reference date and units. Forecasts are labeled as forecasts, and revised probabilities replace—not silently overwrite—the current status while the update log preserves the previous snapshot. When NOAA changes methodology or base periods, the tracker will explain the break rather than splicing incompatible measures into a misleading comparison.

Caveats

  • Weekly Niño-region values are preliminary and noisier than three-month seasonal indices.
  • Recent RONI estimates can be revised as NOAA’s sea-surface temperature analysis is completed.
  • Event strength does not map one-to-one onto impacts in an individual country or season.
  • Probabilities may rise or fall in later monthly outlooks.
  • This page is an explanatory tracker, not a substitute for official weather warnings or local climate services.

Update log

  • July 29, 2026: Tracker launched using NOAA’s July 9 diagnostic discussion. Recorded El Niño Advisory, weekly relative Niño-3.4 of +1.2°C, 97% persistence probability through early spring 2027, and 81% probability of a very strong October–December event.

Continue Reading

More from Earth