
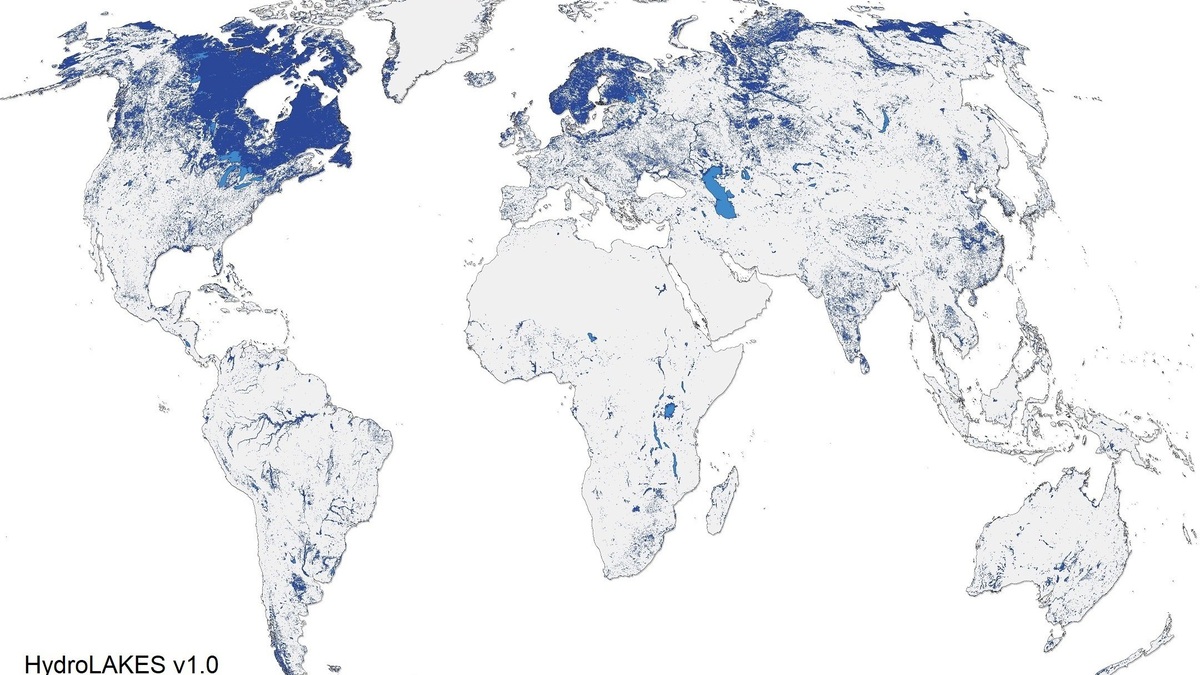
A world map of lakes and ponds shows dense concentrations across Canada, northern Europe and parts of Russia. Other clusters occupy mountain valleys. River floodplains hold shifting lake systems, while tectonic rifts contain some of the deepest basins. Large water bodies dominate a map viewed at continental scale, while millions of small ponds disappear below its resolution.
No single global map includes every lake and pond. Each dataset applies a minimum area and a defined mapping period. It also needs rules for separating adjacent water bodies. Seasonal pools may vanish between satellite observations, while reservoirs and regulated lakes raise classification questions. The legend and technical documentation are therefore as important as the colored polygons.
HydroLAKES maps water bodies of at least 10 hectares
HydroLAKES is a global database of shoreline polygons for lakes and reservoirs with a surface area of at least 10 hectares, or 0.1 square kilometer. It contains about 1.4 million mapped water bodies.
The dataset reports a combined surface area of roughly 2.67 million square kilometers. It also estimates shoreline length, average depth, volume and residence time. Each lake connects through shared identifiers to HydroRIVERS river reaches and HydroBASINS drainage units.
The 10-hectare threshold excludes smaller ponds. HydroLAKES is therefore a consistent global reference rather than a census of every standing-water feature. A farm pond can be ecologically important without appearing. The same is true for a beaver pond or small seasonal pool.
Map resolution changes the apparent number of lakes
A small-scale world map cannot draw each shoreline in detail. Neighboring ponds may merge into one symbol, while narrow channels can disappear. At a larger scale, the same landscape resolves into separate basins with irregular edges.
The HydroLAKES technical documentation estimates a mapping scale between about 1:100,000 and 1:250,000 for most records, with coarser source material in some places. Positional precision therefore varies across regions and should not be assumed uniform.
Satellite sensors introduce another limit because clouds can obscure the water below. Vegetation conceals small pools and dark terrain complicates automated detection. Ice may resemble land under some conditions, while shallow turbid water can be difficult to distinguish from wet soil. A map is a measured interpretation of a date and scale, not the water itself.
Northern glaciated regions contain dense lake country
Continental ice sheets scraped bedrock and rearranged sediment across Canada, Scandinavia and northern Russia. When the ice retreated, water filled countless depressions. Moraines blocked drainage in some places, while scoured rock basins held water elsewhere.
Young postglacial landscapes often have poorly integrated drainage. Streams have not yet cut channels that empty every depression. Lakes fill the larger basins. Smaller ponds occupy nearby hollows, with wetlands spreading across the shallowest ground. The resulting mosaic stands out on global maps.
Lake density does not mean that one region contains the greatest lake surface area. Thousands of small basins can produce a high count while one enormous lake contributes more area. Argo’s guide to the largest freshwater lakes uses surface area, a different measure from number.
Tectonic basins hold some of the deepest lakes
Where Earth’s crust stretches or faults move, long depressions can form. Lake Baikal occupies one tectonic rift. Tanganyika and Malawi fill separate rift basins in eastern Africa. Their maps show narrow shapes aligned with regional geological structures.
Rift lakes may be few compared with northern glacial ponds, yet their depth gives them enormous volume. A surface map alone cannot reveal that storage. Bathymetric surveys are needed to map the basin below the waterline.
Tectonic activity does not explain every large lake. Ice excavated many glacial basins. Other lakes fill volcanic calderas, while additional depressions arose through different processes. A world distribution map shows where water lies; geology explains why each basin exists.
Floodplains and deltas produce shifting water bodies
Rivers abandon channels as their courses migrate. Sediment builds natural levees and floodwater can cut across a bend. Oxbow lakes occupy former meanders, while backwaters fill during floods. Delta lakes form among branching channels and sediment deposits.
Such water bodies can change more rapidly than bedrock lakes. A flood may reconnect an oxbow to the river or fill a shallow pond with sediment. A global database built from several source dates can capture different stages of that evolution.
Temporary connection complicates the lake-river boundary. A basin may behave as a lake during low water and as part of a flowing floodplain during high water. Argo’s comparison of lakes and rivers explains why hydrologic behavior cannot always be reduced to one map symbol.
Dry regions have fewer persistent surface waters
Arid climates lose large amounts of water through evaporation. Persistent river inflow can compensate for the loss. Groundwater sustains other lakes, while a very large drainage basin gathers scarce precipitation over a broad area. Closed basins may become saline because dissolved minerals remain after water evaporates.
Many desert water bodies are intermittent. Their shorelines expand after wet years and contract during drought. A map based on maximum observed extent will look different from one showing water on a single date.
The European Commission’s Global Surface Water Explorer maps changes through time from satellite observations. It emphasizes the occurrence and persistence of surface water. HydroLAKES instead supplies standardized lake polygons linked to geometric attributes.
Reservoirs are part of many global lake datasets
Dams create standing water by impounding rivers. Reservoirs can resemble natural lakes from space. Their levels and flow, however, depend strongly on operations. Some databases classify them separately, while others include them in the same polygon layer.
HydroLAKES includes both natural lakes and reservoirs. Users must check the attribute and source definition before treating every mapped polygon as a natural basin. Regulated natural lakes create an additional middle category.
Reservoir shorelines can fluctuate greatly as storage is released for power, irrigation or flood control. A fixed outline may represent one operating level rather than a permanent coast.
Ponds dominate counts but resist complete mapping
Ponds are generally smaller and shallower than lakes, although no universal area threshold separates them. Some jurisdictions use depth or plant growth instead. Argo’s guide to lake and pond differences explains why the boundary depends on purpose.
Small ponds can appear or disappear within years. Beavers create new water by damming streams. People excavate farm ponds, while drought empties shallow natural basins. Tree canopy hides others from overhead sensors. A complete global inventory would need frequent high-resolution mapping and a stable definition.
Omission from a world map does not imply ecological insignificance. Small ponds can support amphibians. Aquatic insects complete their life cycles there and migratory birds use suitable pools for feeding or rest. Their shallow water also exchanges gases and heat rapidly with the atmosphere.
How to read a world lake map
First identify the dataset’s minimum size and date range. Then check whether it includes reservoirs. Saline lakes and seasonal water require their own definition checks. A count answers how many features meet the rules. Combined surface area describes their footprint, while storage volume requires depth information.
The peer-reviewed HydroLAKES volume analysis used geostatistical estimates where direct depth data were unavailable. Such estimates support global comparison but should not replace a local survey for navigation or engineering. NASA’s account of mapping the world’s lakes shows how satellite observations complement inventories assembled from many regional sources.
A useful world map makes its omissions visible to every reader. HydroLAKES gives a consistent picture of water bodies above 10 hectares. Time-series satellite products reveal how that surface water changes. National inventories can add smaller features, while local surveys provide the greatest detail. A USGS overview of lake basins connects these mapped forms with the water cycle. Argo’s guide to why lakes matter explains why both large and small basins deserve attention.
For named examples across oceans, rivers, seas and lakes, see 20 famous bodies of water around the world.





