
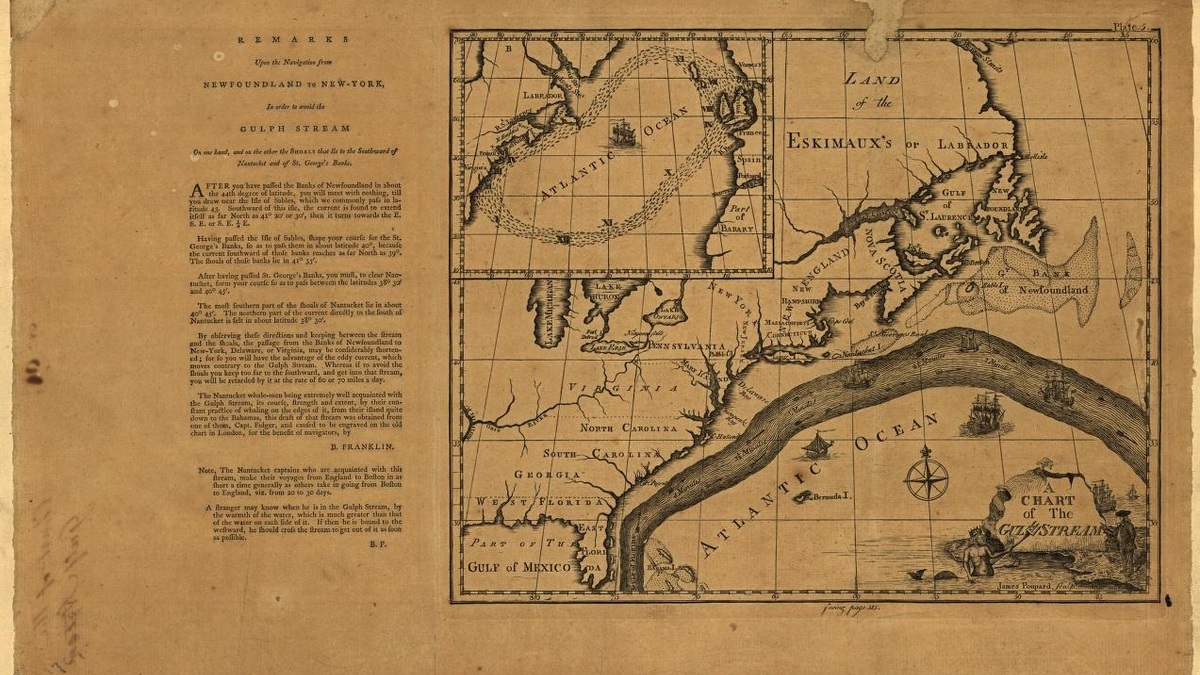
Benjamin Franklin and Nantucket sea captain Timothy Folger produced the first widely recognized chart of the Gulf Stream in the late 1760s. Their map answered a practical postal puzzle: packets sailing west from Britain often took longer to reach New York than experienced American whalers expected. Folger knew where the fast current ran and Franklin recognized that ships could save time by working with it.
NOAA credits Franklin as the first person to chart the Gulf Stream, while historical records show that Folger supplied essential seafaring knowledge. The chart was engraved in London around 1768 and appeared in print in 1769. A later French version helped preserve an idea that English packet captains initially neglected.
Whalers knew the current before mapmakers did
The Gulf Stream had been encountered for centuries before Franklin drew it. Indigenous mariners and European sailors knew that Atlantic waters did not remain still. Juan Ponce de León’s expedition recorded a powerful northward flow near Florida in 1513, where the current could overpower ships trying to sail south.
Nantucket whalers developed more detailed working knowledge. They crossed temperature boundaries and watched the distribution of whales, seaweed and water color. Captain Timothy Folger, Franklin’s cousin, could describe the current’s path from the Florida Straits along the North American coast and then eastward across the Atlantic.
Franklin was serving as deputy postmaster general for the British colonies when colonial officials complained about slow mail. Westbound packets followed routes that placed them against the Gulf Stream, while Rhode Island vessels often avoided its strongest flow. The delay could reach about two weeks, giving a current map immediate economic value.
The Franklin-Folger chart made knowledge portable
Folger traced the current for Franklin and engraver Mount and Page produced the English chart. A thick, sinuous band crossed the North Atlantic, accompanied by notes for navigators. The Franklin-Folger map translated experience held by a small maritime community into information that any captain could carry.
The Library of Congress map record preserves a French edition published in Paris in 1778. Its title describes the current as observed by American navigators and marked by Franklin. Historical editions differ in language and details, which helps explain why publication dates associated with the chart range from the late 1760s into the following decade.
Franklin later measured water temperature during Atlantic crossings. The Gulf Stream is generally warmer than surrounding water, so temperature offered a way to locate its boundary in fog or open sea. Thermometer readings supplemented color, drifting plants and sea conditions, moving navigation toward repeatable physical measurement.
Packet captains did not immediately adopt the advice. Institutional habits and skepticism could outweigh a map based partly on whalers’ reports. Over time, however, understanding the current improved route planning. Eastbound ships could benefit from its speed, while westbound ships often tried to avoid the strongest opposing flow.
Coast Survey replaced a line with measurements
The chart showed where the Gulf Stream ran, but it could not explain its depth, structure or changing edges. In 1845, the U.S. Coast Survey began what NOAA calls the first systematic government oceanographic project focused on a specific phenomenon. The work examined current speed, temperature at depth and seafloor conditions.
Alexander Dallas Bache, Franklin’s great-grandson, led the Coast Survey during this period. Its vessels took soundings and collected biological observations as they crossed the current. NOAA’s ocean exploration timeline notes that the 1860 Gulf Stream chart drew on systematic studies begun in 1845.
Those surveys found bands of warm and cool water rather than a river with rigid banks. They also investigated the Charleston Bump, a seafloor feature that deflects the current offshore. Modern oceanography describes the Gulf Stream as a broad, variable current with meanders and eddies that exchange water with the surrounding Atlantic.
The Office of Coast Survey history places the program within the development of American science. Physical measurements joined navigation, geology and biology. The same integrated approach remains central to research cruises today.
Satellites now map sea-surface temperature and height across entire ocean basins. Drifters, floats and current meters reveal motion below the surface. The NOAA Atlantic Oceanographic and Meteorological Laboratory monitors the current near Florida using submarine cable measurements and other observations, achieving a precision Franklin could not have imagined.
What Franklin’s map got right
The historic chart captured the Gulf Stream’s essential path: warm water leaving the tropics, flowing north near the American coast and bending toward the open North Atlantic. Modern maps show that the current varies daily and sheds rotating eddies, so no fixed line can serve as a permanent boundary.
Its deepest achievement was methodological. Franklin paired a practical question with knowledge from working mariners, then used mapping and temperature observations to test the route. The chart showed how shared observations could improve travel before oceanography existed as a formal discipline.
Calling it Franklin’s map remains common and defensible, yet Folger’s contribution belongs in the same sentence. Benjamin Franklin and Timothy Folger combined scientific curiosity with firsthand expertise. The engraving carried both kinds of knowledge to a wider audience.
The Gulf Stream chart also demonstrates why maps change history even when they are incomplete. A current invisible from shore became a navigable feature with a name, location and practical consequence. Later surveys replaced its bold band with measurements, while retaining the question that started the project: how can ships use the ocean’s motion instead of fighting it?
The current is wider and deeper than the old chart
Near Florida, the Gulf Stream forms part of a larger circulation that carries warm water northward. It intensifies along the western edge of the Atlantic because Earth’s rotation and basin-scale winds organize the subtropical gyre. Farther north, it separates from the coast near Cape Hatteras and develops large meanders.
The visible surface current is connected to deeper flow, although speed changes with depth and location. Oceanographers distinguish the Gulf Stream from the broader Atlantic Meridional Overturning Circulation, which includes deep southward transport. The two are related components of Atlantic circulation, but their names do not describe the same physical quantity.
Modern forecasts represent the current as a moving field rather than a single fixed path. Satellite temperature and sea-level patterns show its fronts, while autonomous floats sample subsurface water. Franklin’s thick line remains recognizable because it captured the central route, even as newer instruments reveal motion on scales from swirling eddies to basin-wide circulation.
The current influences weather and marine life along its route by moving heat and creating sharp boundaries between water masses. Fish and plankton can concentrate near fronts, while warm eddies carry Gulf Stream water into the cooler Atlantic. Navigators still seek favorable currents, now using forecasts that update as the flow bends and shifts.
Historical maps remain scientific evidence as well as artifacts. Comparing editions reveals what information circulated, which names were used and how practical observations entered formal knowledge. The 1769 chart marks an early step in that record. Its partnership between a statesman and a working captain is as important as the line they placed across the Atlantic. Surviving copies also show how engraving and translation carried the idea between scientific communities. Later survey charts added systematic soundings and temperature sections, preserving a visible record of progress from informed route advice to physical oceanography. Each generation retained the current’s broad identity while adding dimensions Franklin and Folger could not measure. Today’s observing systems continue the same practical tradition by helping vessels anticipate changing surface flow.
Related reading: surface and deep-ocean currents and how scientists measure ocean currents.





