
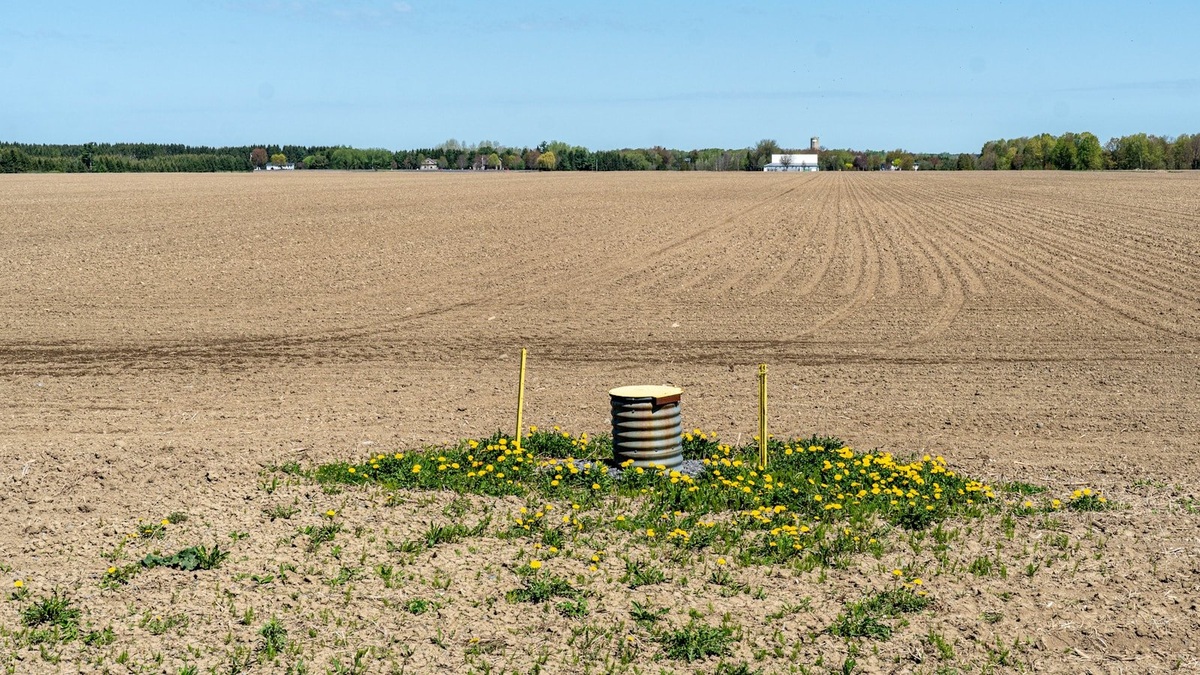
The water table is the upper surface of the saturated zone underground. Below it, connected pores and fractures are filled with water. Above it, the same openings usually contain both air and moisture. Its depth can range from near the land surface beside a wetland to hundreds of feet beneath dry uplands.
The water table is a boundary, not a buried river or a flat sheet. It rises, falls and slopes through the landscape as recharge, drainage and pumping change. Understanding that moving surface explains why one well has water while another nearby well is dry.
The saturated zone begins at the water table
Rainwater that enters the soil first passes through the unsaturated zone. Some adheres to soil grains and supports plants. Some evaporates or is taken up by roots. Water that continues downward eventually reaches openings already filled with water. The top of this fully saturated material marks the water table in an unconfined aquifer.
Pressure at the water table is approximately atmospheric. Deeper groundwater is under greater pressure because of the water above it. Hydrogeologists often call the underground elevation of water hydraulic head, since elevation and pressure together govern its potential to flow.
The USGS groundwater-storage explanation emphasizes that rock must have connected openings to release useful water. Porosity describes how much open space exists. Permeability describes how readily water passes through those connections. High porosity alone does not guarantee a productive aquifer.
The water table follows the landscape imperfectly
In a humid region, the water table often resembles a subdued version of the land surface. It may stand higher beneath hills and approach the ground in valleys. The slope is gentler than the topography because groundwater moves laterally toward lower hydraulic head.
Where the water table intersects the land, groundwater can appear as a spring, seep or wetland. It can also enter a stream through the bed. This underground contribution supplies baseflow that keeps many rivers running between storms.
Local geology complicates the pattern. A clay layer can hold a perched body of groundwater above the regional water table. Fractured rock may direct water along narrow routes. Valleys filled with permeable sediment can contain an alluvial aquifer connected to the river, while adjacent bedrock transmits far less water.
Maps therefore represent measured or modeled elevations rather than a universally smooth surface. Contours connect locations with equal groundwater elevation. Flow in an unconfined aquifer generally crosses those contours from higher values toward lower ones, although pumping can bend the pattern.
Rainfall does not raise it immediately everywhere
Recharge raises the water table when infiltrating water reaches the saturated zone. The timing depends on soil, depth and geology. A shallow water table beneath sand may respond quickly to sustained rain. Deep groundwater beneath fine sediment can react slowly because water must cross a thick unsaturated zone.
Seasonal cycles are common. Cool-season precipitation may recharge an aquifer when plant use and evaporation are low. During the growing season, roots intercept more moisture before it can descend. Snowmelt can create a pronounced spring rise where frozen ground and melt timing permit infiltration.
A single storm does not always produce measurable recharge. Dry soil may absorb the water and plants may use much of it. Intense rain can run off when it falls faster than the ground accepts it. The USGS account of infiltration shows why water reaching the ground surface is only the start of the recharge process.
Wells reveal the water table but also disturb it
In a properly constructed monitoring well open to an unconfined aquifer, the standing water level approximates the local water table. Surveyors measure its depth from a known reference point. Repeated readings reveal seasonal variation, drought effects and long-term trends.
Pumping changes the measurement. Removing groundwater lowers head near the well, creating a cone of depression. The water level in an actively pumped well is therefore lower than the undisturbed level nearby. Hydrologists distinguish the static level measured after recovery from the pumping level observed during withdrawal.
Nearby wells can influence one another when their cones overlap. A strong municipal or irrigation well may lower the level in smaller domestic wells even without emptying the aquifer. Argo’s overview of water-level and flow measurements provides useful context for why a height reading must be paired with its time and conditions.
Confined aquifers use a different surface
The term water table applies most precisely to an unconfined aquifer. A confined aquifer is overlain by material that transmits water slowly, so its groundwater remains under pressure. A well penetrating that aquifer may contain water that rises above the aquifer’s top.
Hydrogeologists describe the levels in tightly cased wells with the potentiometric surface. This imaginary surface represents the height to which water would rise because of pressure. If it stands above the ground, a flowing artesian well can discharge without a pump. The physical opening is still a well; pressure within the confined system supplies the lift.
Confusing the potentiometric surface with the water table can lead to mistaken conclusions about aquifer thickness or recharge. A deep well can have a high water level while drawing from rock far below. Depth alone does not make a well artesian and an artesian well does not require an underground void.
Why water-table depth affects land and water use
A shallow water table can sustain wetlands and plant roots, but it can also limit septic-system performance or flood basements. Construction plans often account for the seasonally high level rather than relying on one dry-weather observation. Soil color, monitoring wells and local records help establish the likely range.
A falling water table increases the lift required to pump groundwater. Wells may produce less when the level approaches the pump intake. Continued decline can reduce groundwater discharge to streams and lakes, affecting ecosystems before the regional aquifer is physically drained.
Water-table maps also guide contamination studies. Dissolved chemicals commonly move with groundwater from recharge areas toward discharge points. The USGS surface-water and groundwater program explains that these exchanges can carry nutrients and contaminants across the boundary.
The simplest definition remains useful: the water table is the top of underground saturation. Its real value comes from treating it as a changing hydraulic surface. Measurements must be tied to location, aquifer and time because weather, geology and pumping can all move it.
How the depth is measured and reported
A manual measurement commonly uses a marked electric tape that signals when its probe touches water. Pressure transducers can record levels automatically at intervals, revealing changes that a single visit would miss. The measured depth is subtracted from the surveyed elevation of the reference point to obtain groundwater elevation.
Elevation lets researchers compare wells on uneven land. A well with water 20 feet below ground on a hill may still have higher hydraulic head than a shallow well in a valley. Groundwater flows in response to head, not simply toward whichever well has the smaller depth-to-water number.
Reports should identify the aquifer, date, reference point and whether a well was recently pumped. Barometric pressure can influence some confined-well measurements and tides affect coastal aquifers. Consistent methods allow a sequence of readings to reveal a real trend instead of changes caused by equipment or operating conditions.
Homeowners can use a professional well inspection to determine static water level and pump placement, but a regional water-table map requires many wells. The interpolation between them carries uncertainty, especially where fractures or confining layers make groundwater conditions change over a short distance.
Depth to water should never be confused with the thickness of saturated material. A measurement can locate the upper boundary without showing where the aquifer ends. Well logs, drilling samples and geophysical data are needed to identify the complete water-bearing interval.





