
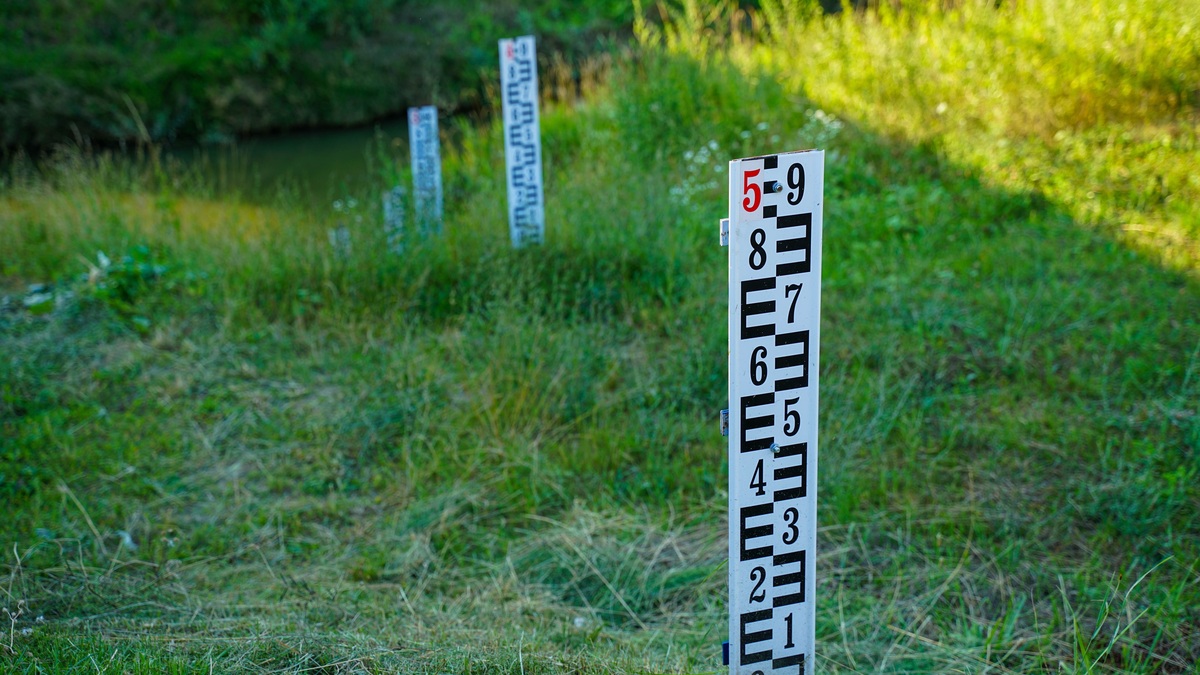
River stage is the height of the water surface above a chosen reference elevation at one location. Discharge is the volume of water passing that location per unit of time. A streamgage can record stage continuously, but hydrologists usually need a site-specific relation called a rating curve to convert that height into an estimated flow.
The two measurements answer different questions. Stage describes how high the river is at the gage, often in feet. Discharge describes how much water is moving downstream, commonly in cubic feet per second in the United States. The distinction explains why a river-level reading alone cannot reveal flow without information about the channel.
Stage is a water-surface elevation
A gage measures water level relative to a local datum rather than automatically reporting elevation above sea level. The zero may be set below the lowest expected water surface so ordinary readings remain positive. A stage of 8 feet therefore means the surface is 8 feet above that station’s reference, not that the river is 8 feet deep everywhere.
Modern stations may sense stage with a pressure transducer, a radar instrument mounted over the water or a float inside a stilling well. The result is a time series showing rises and falls at that particular cross section. Readers can follow current observations through Argo’s river-level dashboard, but flood decisions should always use the official forecast and warning source named for the site.
Gage height is local. Two stations on the same river can have different datums and channel forms, so their numerical stages cannot be compared as if they shared one ruler. Flood-action stages are also station-specific thresholds tied to local impacts rather than universal measures of danger.
Discharge measures a volume rate
Discharge combines the size of the flowing cross section with the water’s average velocity. In simplified form, flow equals area multiplied by velocity. One cubic foot per second is a continuous passage of one cubic foot of water each second, about 7.48 gallons per second.
Hydrologists make a direct discharge measurement across a river. They divide the cross section into subsections and measure both depth and water speed before summing the flows. Equipment varies with conditions. A technician may wade a shallow stream with a velocity meter. Deeper water can require an instrument lowered from a bridge or an acoustic Doppler device operated from a boat.
The USGS streamflow procedure describes four basic steps: measuring stage, measuring discharge, defining their relation and applying that relation to the continuous stage record. Repeated measurements must span the river’s ordinary range and capture both low water and floods.
A rating curve connects height with flow
A stage-discharge rating curve plots measured discharge against the stage observed at the same time. Once enough points define the relation, computers can convert each recorded stage into an estimated discharge. The conversion is site-specific because the channel’s cross-sectional form controls how much water fits at a given height. Slope and surface roughness influence its speed.
The relation is nonlinear. If water is confined in a narrow channel, a modest rise may accompany a large flow increase. Once water spreads across a broad floodplain, a small additional rise can represent another large increase in volume. Doubling stage therefore does not mean discharge doubles.
The USGS streamgaging guidance explains that every point on a rating graph comes from a discharge measurement. Hydrologists extend the curve cautiously toward rare high flows, where direct measurements are hard to obtain and uncertainty is greater. Values shown online can remain provisional until records and rating adjustments are reviewed.
One height can sometimes correspond to different flows. Tides can weaken the ordinary stage-flow relation, as can backwater behind a downstream obstruction. Rapidly changing flood waves pose another complication. At such sites, an index-velocity method may continuously measure water speed and combine it with cross-sectional area.
River channels change the conversion
A rating curve is maintained rather than discovered once. Floods can scour the bed or deposit sediment. Aquatic vegetation can add seasonal resistance, while ice and debris alter the space available to flowing water. Construction near a bridge can also change hydraulic conditions.
USGS hydrographers compare new field measurements with the existing curve and apply a temporary shift or develop a new rating when the relation changes. The agency’s rating-curve explanation notes that subtle natural changes occur at almost every station over time. A discharge displayed beside a real-time stage is consequently a calculated value supported by the current rating.
Uncertainty often grows beyond the measured range. A record flood may exceed all prior direct observations, forcing an extrapolation or a later reconstruction from surveyed high-water marks and channel geometry. Users should treat qualifiers such as “provisional” as meaningful, especially during extreme events.
How to read a streamgage page
First identify the station and datum. Then determine whether the graph shows gage height or discharge; some pages display both on separate axes. Check the timestamp and time zone before interpreting a sharp rise. A stale transmission can otherwise look like a stable river.
Next compare present values with the station’s historical context and official flood categories. A high discharge can remain within the banks of a large river, while a smaller flow can flood a constrained creek. Local thresholds encode the relevant geometry and exposure more effectively than a raw national comparison.
Stage is usually the direct continuous observation, while discharge is usually the derived flow estimate. Together they provide a far better account than either series alone: stage connects to local inundation and discharge supports water-supply analysis, ecological studies and comparisons through time.
Stage and discharge support different comparisons
Stage is most useful for impacts near the station. Emergency thresholds are normally expressed as gage height because roads and buildings begin flooding at local elevations; a boat ramp may be affected at another level. Discharge is more suitable for comparing the amount of water conveyed at one site through time, provided the estimates meet the same quality standard.
Comparisons among rivers need another adjustment. A discharge of 10,000 cubic feet per second is enormous for a small creek and ordinary for some large rivers. Analysts may divide flow by drainage area or compare it with the station’s historical percentiles. Basin context, including the drainage framework described in Argo’s watershed overview, gives the number physical meaning.
Flood stage does not rank flood size nationally. It marks a local threshold and the discharge associated with it may change if the channel or flood-control system changes. Official forecasts combine observed stage with rainfall. Hydrologic models then project conditions across the basin rather than extending one real-time measurement indefinitely.
Measurement records carry quality labels
Real-time telemetry is valuable because it arrives quickly, yet the first value is not necessarily the final published value. Sensor drift can require correction. Ice interferes with some records and communication failures create gaps. Field measurements made later also help determine whether the active rating curve represented the channel accurately during an event.
The finalized record may contain estimates for missing periods and notes about unusual conditions. Researchers using a long series should consult station metadata instead of downloading numbers without qualifiers. Measurement uncertainty changes with conditions and it is often largest during the rare floods that attract the most attention.
Stage and discharge records also support water-quality interpretation. A cloudy river during high discharge may carry more sediment than the same turbidity at low flow. Argo’s guide to water-pollution types shows why concentration, transport and river volume answer related but separate questions.





