
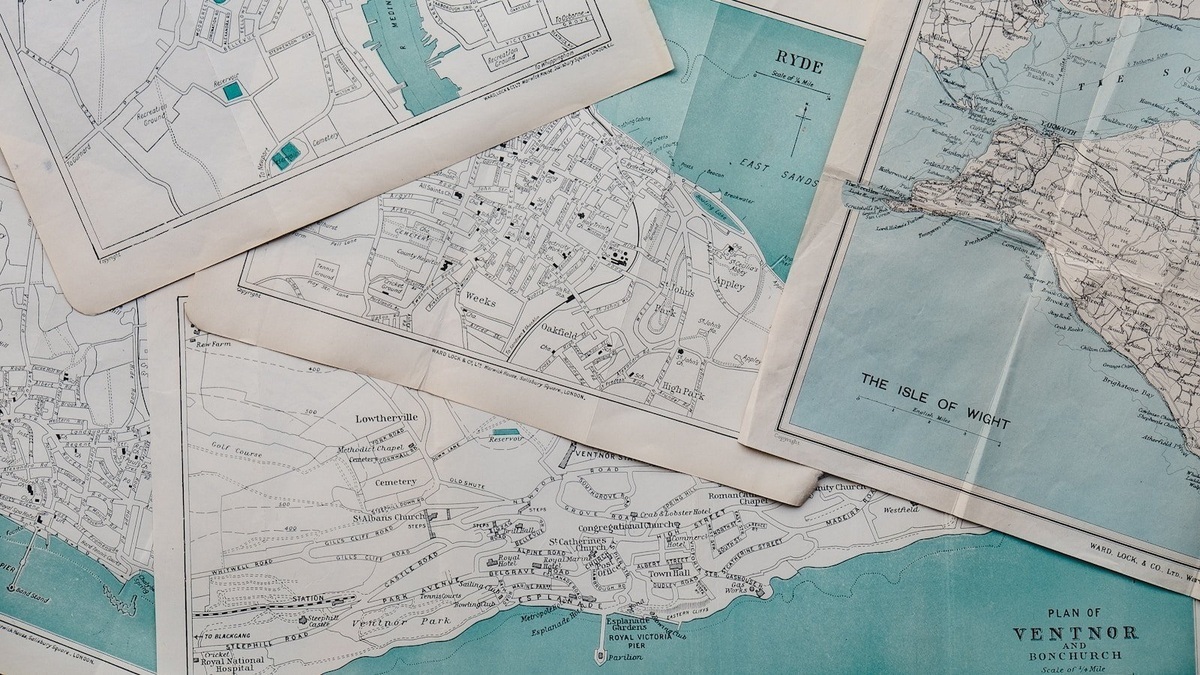
Bathymetry is the measurement and mapping of water depth. A bathymetric map shows the underwater relief of a lake or ocean basin, including slopes, ridges, canyons, trenches and plains. It is the submerged counterpart of a topographic map, but collecting the measurements is far harder because water hides the landscape from ordinary cameras and most satellite sensors.
Modern bathymetry combines shipborne sonar, measurements from smaller boats, autonomous vehicles and indirect observations from satellites. NOAA’s explanation of bathymetric mapping describes how depth measurements reveal the terrain beneath water and support nautical charts.
No single instrument produces a finished map by itself. Surveyors must know where the sensor was, how fast sound traveled through the water and how the vessel moved. Processing then removes errors and converts millions of soundings into a coherent surface.
Sound measures depth where light cannot reach
An echo sounder transmits a sound pulse toward the bottom and listens for its return. Because the pulse travels down and back, the system divides the total travel distance by two. Multiplying the one-way travel time by the local speed of sound produces an estimated depth.
Sound speed in seawater changes with temperature, salinity and pressure. Survey crews therefore lower instruments that measure these properties through the water column. An incorrect sound-speed profile can bend acoustic paths and shift seafloor features away from their true positions.
Early lead-line surveys sampled depth one point at a time. Single-beam sonar later produced continuous profiles directly under a vessel. Multibeam sonar now sends a fan of beams across the ship’s track, collecting a wide strip of depth measurements with every ping.
Water-column features can complicate the measurement. Dense biological layers and bubble plumes return echoes before a pulse reaches the bottom. Bottom-detection algorithms may select the wrong arrival, especially along steep walls. Analysts inspect the full acoustic record where automated picks create improbable spikes or pits.
Multibeam surveys build a swath of seafloor
A multibeam array measures the direction and travel time of many returning echoes. Adjacent survey lines overlap enough to cover the target area. The resulting point cloud can show subtle channels or steep volcanic slopes that sparse track lines would miss.
Woods Hole Oceanographic Institution explains that multibeam bathymetry maps broad areas efficiently. Coverage usually widens in deep water because the acoustic fan reaches farther to each side, although each footprint on the bottom also becomes larger and fine detail is lost.
Researchers bring sonar close to the seabed when they need finer resolution. Towed systems and autonomous underwater vehicles can map selected sites from tens or hundreds of meters above the bottom. The approach sacrifices wide coverage and simple operations in exchange for sharper terrain.
Survey lineage is as important as visual detail. Two adjacent cells may come from cruises decades apart, using different instruments and datums. Modern compilations preserve source identifiers so analysts can return to the original soundings, inspect uncertainty and avoid treating an interpolated gap as a measured feature. Depth validation against crossing lines and independent surveys provides the final test.
Satellites infer broad seafloor structure
Radar altimeters aboard satellites measure tiny variations in sea-surface height. Underwater mountains add gravitational attraction that pulls water into a slight bulge, while deep trenches produce a corresponding depression. Scientists use these patterns to infer large seafloor features between ship tracks.
Satellite altimetry cannot replace direct sonar soundings for navigation or detailed geology. Its strength is consistent global coverage. It identifies broad structures and helps researchers decide where new ship surveys will provide the greatest improvement.
NOAA’s Bathymetric Data Viewer brings together multibeam surveys and other archived records. Map users need to inspect the source, date and resolution because a smooth-looking grid may blend direct measurements with estimates across large gaps.
Processing determines whether a map is reliable
A ship rolls, pitches and heaves as it moves. Motion sensors track each change so software can correct the beam directions. Precise satellite navigation fixes the vessel’s location, while measurements of the water level connect sonar depths to a defined vertical reference.
Analysts flag false echoes from bubbles, fish or instrument noise. They compare overlapping passes, correct sensor offsets and inspect abrupt depth jumps. A final grid assigns a depth to regularly spaced cells, but the chosen cell size must match the actual density and accuracy of the observations.
Uncertainty grows toward the outer beams and in rough terrain. Steep walls can cast acoustic shadows and soft sediment may return a weak signal. Responsible maps retain metadata describing equipment, processing and expected error instead of presenting every colored pixel as equally certain.
Bathymetry guides ships and science
Hydrographic offices use detailed surveys to chart channels, shoals, wrecks and other navigation hazards. Engineers need bathymetry when placing cables, pipelines or offshore structures. Emergency planners combine coastal terrain with water-level models to estimate tsunami and storm-surge flooding.
For scientists, seafloor form records geological process. Ridges mark crustal creation, trenches mark subduction and submarine canyons carry sediment from continental margins. Argo’s survey of seafloor topography explains how these landforms fit together across an ocean basin.
Biologists also use depth, slope and bottom character to map habitat. A rocky ledge swept by current offers different conditions from a nearby muddy basin, even at the same latitude. Bathymetry supplies the physical framework for interpreting where communities occur.
Resolution and coverage answer different questions
A global grid is suitable for studying the scale of an ocean basin, while a harbor chart must resolve much smaller hazards. The word resolution describes the spacing or size of map cells, not a guarantee that every cell contains a direct measurement.
Coverage remains incomplete because the ocean is vast and ship surveys are slow. Data gathered for navigation, research and industry also vary in access and quality. International mapping efforts seek to assemble available observations and target poorly mapped regions.
Reading a bathymetric map well requires three questions: how were the depths measured, how far apart were the observations and how much processing filled the gaps? The answers reveal whether a map can support a broad illustration, a scientific calculation or a decision where meters of error carry real consequences.
Vertical references keep depths comparable
A depth needs a reference surface. Nautical charts commonly reduce soundings to a tidal datum chosen to provide a useful safety reference, while scientific grids may use mean sea level or another geodetic surface. The numerical depth of one point can therefore differ between products without either measurement being wrong. Metadata should name the vertical datum.
Coastal surveys use tide gauges or models to account for changing water level. Offshore work increasingly connects sonar observations to satellite positioning and gravity-based reference systems. Waves still move the vessel moment by moment, so a motion sensor records heave. Surveyors also measure the transducer’s depth below the waterline and its exact offset from the positioning antenna.
Uncertainty surfaces show where a grid is well constrained. Dense modern multibeam lines can support fine cells, whereas a deep basin derived mainly from satellite gravity carries larger uncertainty. Hill shading may make both datasets look equally detailed, which is why responsible users examine lineage rather than judging only visual sharpness.
Map scale determines what a reader should infer. A trench shown on a global map is a broad regional feature, not a navigation-ready depiction of its walls. A harbor survey can resolve small hazards but says little about an entire continental margin. Bathymetry becomes most useful when the measurement method, grid size and decision are matched.
Contours connect points of equal depth and their spacing conveys slope: tightly packed contours indicate steep terrain. Color ramps can reinforce the pattern, yet palette choices sometimes exaggerate small relief. A labeled scale bar, contour interval and depth legend make a bathymetric map interpretable without relying on dramatic shading.
Bathymetric surveys use instruments such as multibeam and side-scan sonar. Interpreting sonar backscatter adds information about the character of the seafloor.





