
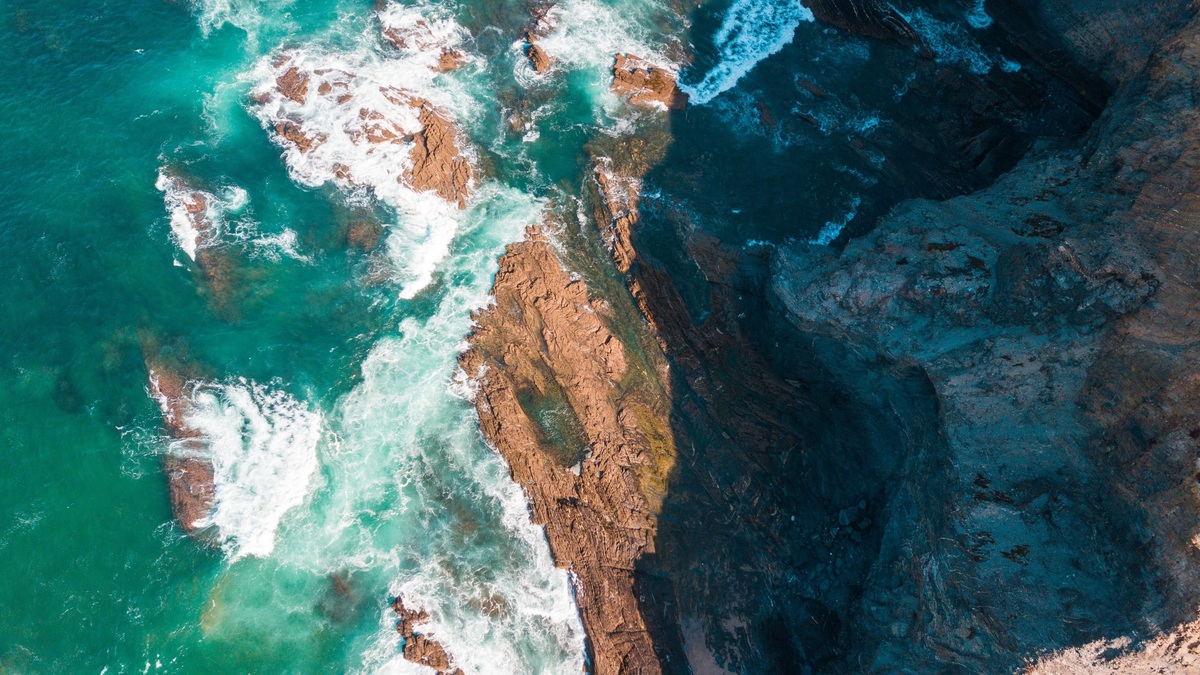
A king tide is a popular name for an exceptionally high tide. The term has no formal scientific category or worldwide threshold. The highest predicted tides usually occur when the sun, moon and Earth are nearly aligned, often near the time when the moon is closest to Earth. Local coastline shape and seasonal water levels determine how high the water actually reaches.
NOAA’s king tide definition deliberately calls the term nonscientific. Tide tables provide the predicted height at a station, while “king tide” helps communities describe the few days when normal astronomical tides reach the upper end of their local range. Weather can add water and make an event higher than predicted.
Why exceptionally high tides occur
Tides arise mainly from the moon’s gravity, with the sun adding a smaller influence. The gravitational forces vary across Earth, creating ocean bulges while the planet rotates. Continents, seafloor depth and the shape of bays complicate that simple picture, so actual tidal timing and range differ widely from one coast to another.
During a new or full moon, the sun, Earth and moon are close to a line. Their tide-producing forces reinforce one another and create a larger-than-average difference between high and low water. Oceanographers call this a spring tide. The name refers to water springing upward and has no necessary connection to the season.
The moon follows an elliptical orbit. At perigee, its closest point to Earth during an orbit, its tide-producing influence is somewhat stronger. When perigee falls near a new or full moon, a perigean spring tide occurs. Many events described as king tides happen under that alignment, though communities may also use the label for other seasonally high tides.
Solar distance and declination contribute smaller variations through the year. Their effects combine with lunar cycles differently from coast to coast. Tide predictions resolve the astronomical components mathematically, so residents do not need to identify every alignment themselves. The useful question is how the predicted height compares with familiar local levels.
The alignment is gradual rather than an on-off switch. The Moon’s changing distance and phase evolve continuously, while each coast responds through its own basin geometry. Consequently, two places can apply the phrase king tide on different dates and neither usage defines a new physical type of tide.
Prediction versus observed water level
Astronomical tides are highly predictable because the motions of the moon and sun can be calculated far ahead. Tide agencies also use long records from gauges to determine how a particular harbor responds to those forces. NOAA publishes station tide predictions with local times and heights referenced to established vertical datums.
The number in a tide table describes the expected astronomical tide, rather than a guarantee of the water seen at the shoreline. Persistent onshore wind can pile water against a coast. Low atmospheric pressure allows the surface to rise, while ocean-current changes can raise regional sea level. Large waves create runup. Rainfall may worsen drainage even when it does not directly change the tide.
Seasonal cycles also count. Warm water expands as river flow changes through the year. Prevailing winds and currents shift as well. Along some U.S. coasts, the seasonal peak in mean water level coincides with certain spring tides. The combined observed level may therefore exceed the tide-only prediction by a meaningful amount.
Gauge observations let forecasters compare prediction and reality. The difference, sometimes called a residual, contains weather and other non-tidal influences. A positive residual means observed water is running above the astronomical estimate. Checking recent observations before the predicted peak can reveal whether the coast already has an elevated starting level.
King tides and coastal flooding
A king tide can remain entirely within the normal waterfront when land is high enough and weather is calm. Flooding begins when the observed water crosses a local elevation or impact threshold. Low streets, parking areas, yards and waterfront paths may be the first places affected.
Drainage systems create another route inland. High seawater can block gravity-fed storm drains or flow backward through outfalls, leaving salt water on streets with no rain. The NOAA flooding outlook tracks the days when predicted conditions may reach local thresholds. Official products generally use high-tide flooding for the impact and reserve “king tide” for the unusually high astronomical tide.
Storm surge remains a separate process caused largely by sustained wind during a storm. When surge, waves and a king tide coincide, their effects can overlap. The tide supplies a higher starting water level, allowing less additional water to reach roads or structures. Forecasts should be checked close to the event because weather determines much of the final height.
Flood depth is only one impact measure. A few inches of saltwater can close a road, push through a low doorway, or prevent stormwater from draining. Repeated exposure corrodes metal and damages vegetation poorly adapted to salt. Calling such events “nuisance” can understate their effect on commuters, emergency access and property maintenance.
How sea level rise changes the view
Rising relative sea level lifts the baseline beneath every tide. Relative sea level combines changes in ocean height with vertical land movement, including subsidence. A tide of the same astronomical size can reach farther inland today than it did when the local baseline was lower.
King tides offer a visible preview of water levels that may become more common. Photographs taken from fixed, safe locations can reveal which drains back up and which paths lose access. They do not by themselves predict a specific future year, but repeated observations tied to tide-gauge measurements help planners identify vulnerable elevations.
Citizen-science programs use repeat photography to document local impacts. Useful records include the exact time, location, viewing direction and whether rain, wind, or waves were present. Comparing like with like is essential because an image taken during heavy surf cannot isolate the astronomical tide.
Long records improve the comparison. A photo showing water at the edge of a road gains meaning when paired with the station’s observed level and the road’s surveyed elevation. Repeating the view during later events can reveal changes in flood frequency, drainage performance, or shoreline condition without claiming that one photograph measures sea level rise by itself.
How to read a king tide forecast safely
Begin with the nearest official tide station and confirm its location. Predicted times can differ between a harbor entrance and an upstream creek. The stated height also depends on the vertical datum, so a number cannot be compared directly with road elevation unless both use compatible references. NOAA’s tide tutorial explains how wind and weather modify astronomical predictions.
Next, check coastal flood statements, wave forecasts and local road information. A predicted high tide near a threshold deserves extra caution when onshore winds or heavy rain are expected. Avoid walking or driving through floodwater, which can hide holes, moving debris, or electrical hazards. Salt water can also damage vehicles at depths that look shallow.
On an open beach, unusually high water reduces dry sand and can cut off routes around headlands or cliffs. Strong shore break and floating logs add danger in some regions. Observe from stable ground above the water, keep children and pets away from the edge and never stand on wave-washed rocks for a photograph.
The simplest interpretation is local: a king tide is one of the year’s highest predictable tidal stages, while the observed outcome depends on weather and coastal setting. Tide predictions show when to look. Flood alerts show when an interesting event may become a public-safety problem.
Related reading: how ocean waves form and spring tides and neap tides.





