
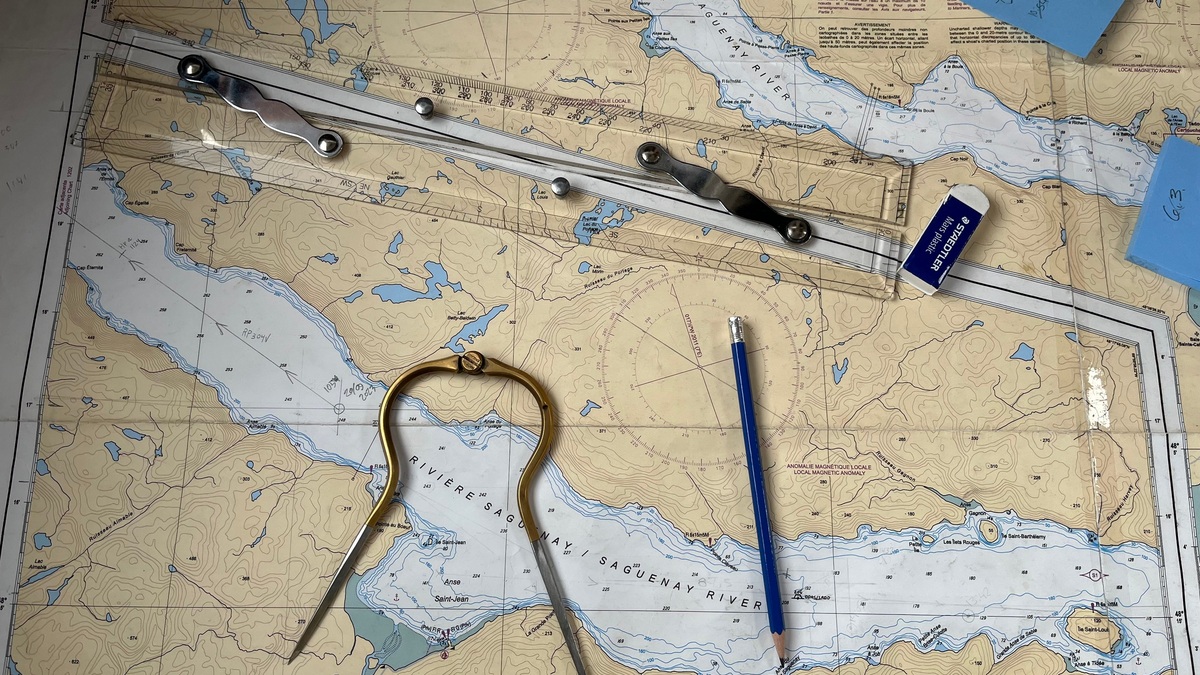
A nautical chart and an ordinary map both describe places, but they are built for different decisions. A road map helps a traveler choose among established routes. A nautical chart gives a mariner the locations of hazards and navigation aids alongside the measured depths needed to choose a safe route across water where no lane may be visible.
NOAA’s explanation of the difference between a nautical chart and a map centers on hydrographic information. Charts show the shoreline and the water beside it, including features hidden below the surface. General maps place greater emphasis on landforms, roads, boundaries and other geographic reference points.
The distinction affects how each product is made and read. A chart is a working navigation document. Its symbols, depth figures, scale and update status can influence whether a vessel clears a shoal, passes beneath a bridge or approaches a harbor through the correct channel.
A chart describes the navigable water
A standard topographic map represents elevation with contours and spot heights. A nautical chart extends that measured landscape underwater. Numbers called soundings mark depths. Depth contours connect areas of equal depth, while colors help separate shallow water from deeper water.
Charts also identify the nature of the seabed when the information is useful. Mud, sand, rock and coral can affect anchoring or the consequences of running aground. Wrecks, reefs, submerged cables and pipelines appear with symbols that convey both the feature and, where known, its clearance.
The shoreline is more complicated than a fixed line. Tides expose and cover parts of a coast. Charted depths and elevations must consequently refer to stated vertical datums. NOAA’s tides and currents guidance explains the reference levels used to relate measurements to predictable stages of the tide.
Land still appears because a navigator needs recognizable points. Prominent buildings can help confirm position from the water alongside visible towers or hills. The selection favors features that support navigation rather than every attraction or street a city map might display.
Symbols carry operational meaning
A buoy icon on a chart does more than record an object. Its shape, color, light rhythm and identifying characters tell mariners how the aid marks a channel or hazard. Lighthouses and fog signals have standardized descriptions, as do beacons.
Chart symbols compress a large amount of information into limited space. The U.S. Chart No. 1 reference explains the abbreviations and symbols used on American paper products and electronic displays. Learning that visual language is part of competent navigation.
Scale controls what can be shown. A harbor chart covers a small area at large scale. Its larger scale allows more soundings and local detail. An ocean passage chart covers far more territory. Small hazards and fine shoreline detail may therefore be generalized or omitted.
Zooming a recreational map can create the impression that more detail must exist at every level. Chart data were compiled for particular scales and purposes. Magnifying a small-scale chart cannot recover measurements that were never included and it can make positions appear more precise than the source supports.
Notes and caution areas are equally important. They may describe shifting channels, restricted zones, unusual currents or surveys that are older than surrounding data. A navigator reads those qualifications along with the picture.
Mariners plot rather than follow
Road maps usually direct users along predetermined roads. Open water gives a vessel more freedom, but draft, weather, traffic rules and underwater terrain constrain the safe choices. Mariners plot a course as a series of legs while checking bearings and distances against charted hazards.
A position from satellite navigation becomes useful when placed in this context. The dot may be accurate while the charted depth nearby comes from an older or less detailed survey. Safe navigation combines position, chart quality, the vessel’s draft and real observations from depth sounders, radar and the view outside.
Routes also change with the vessel. A deep-draft ship may need a dredged channel where a small boat has room to maneuver elsewhere. An available route can become unsafe because of bridge clearances or overhead power lines. Tidal windows impose another constraint.
Official charts are maintained records
Government hydrographic offices issue official nautical charts for their waters. In the United States, NOAA’s Office of Coast Survey has carried out that role since the nineteenth century. Its chart FAQ describes a nautical chart as a specific type of map designed for marine navigation.
Maintenance is essential because dredging changes channels. Buoys move over time, while new structures appear. Surveys can reveal previously unknown shoals or revise depths after storms. Electronic charts allow corrected data to reach users more quickly, although mariners still need to install updates and use the product properly.
NOAA ended production of its traditional paper nautical chart series in 2024 and now maintains electronic navigational charts as its primary chart product. Users who need paper can create printable products derived from official electronic data with NOAA Custom Chart.
The legal role follows from the chart’s safety purpose. The U.S. chart carriage guidance links to Coast Guard rules governing which vessels must carry charts and publications. Requirements differ by vessel and voyage, so a recreational boater’s mobile display is not automatically equivalent to an approved system aboard a commercial ship.
Electronic charts are structured data
An electronic navigational chart, or ENC, is more than a scanned image. It is a standardized vector database in which coastlines, depth areas, buoys and obstructions are stored as objects with attributes. A compatible display can select information for the current scale and issue warnings based on settings such as safety depth.
Large international vessels generally use an Electronic Chart Display and Information System, known as ECDIS, with official ENC data. Smaller craft may use an electronic chart system or chart plotter. Similar-looking screens can have different certification, update procedures and legal status.
Digital presentation introduces its own reading skills. Too much information can clutter a display, while filtering can hide features. Safety contours and alarms depend on correct vessel settings. The navigator remains responsible for understanding what is displayed and what has been suppressed.
Paper retains practical value for planning and backup, but its information begins aging as soon as conditions change. Digital delivery improves correction speed. Neither format excuses the use of an outdated chart.
Maps remain useful aboard a vessel
A general map can show road access to a marina, regional geography or land ownership more clearly than a chart. Weather maps describe atmospheric conditions and specialized fishing or habitat maps answer questions outside the chart’s core navigation purpose.
Products should be chosen by the decision they support. The NOAA chart tutorial compares road and nautical information while emphasizing that hidden underwater dangers require a different visual record.
Recreational apps sometimes combine an official chart layer with satellite imagery, community reports and routing tools. Those additions can be convenient, yet their presence does not make every layer official or current. Users should identify the underlying chart edition and the source of supplemental data.
The simplest test is practical. If a person needs to understand where a place lies, a map may be enough. If a mariner needs to know whether a vessel can safely pass through the water, an up-to-date nautical chart provides the specialized evidence for that judgment.
Chart accuracy has practical limits
Depth figures do not promise that every point between soundings was measured. Survey lines may leave gaps and mobile sand can change after a survey. Source diagrams and quality indicators help trained users judge how closely an area was examined and how much confidence to place in the charted bottom.
Real-time judgment remains essential in narrow or changing water. Notices to mariners, local warnings and a vessel’s instruments can reveal conditions newer than the chart. A careful navigator treats the chart as an authoritative foundation and checks it against current information rather than assuming the seabed is permanently fixed.
Related reading: the first maps of the Gulf Stream and how nautical miles work.





