
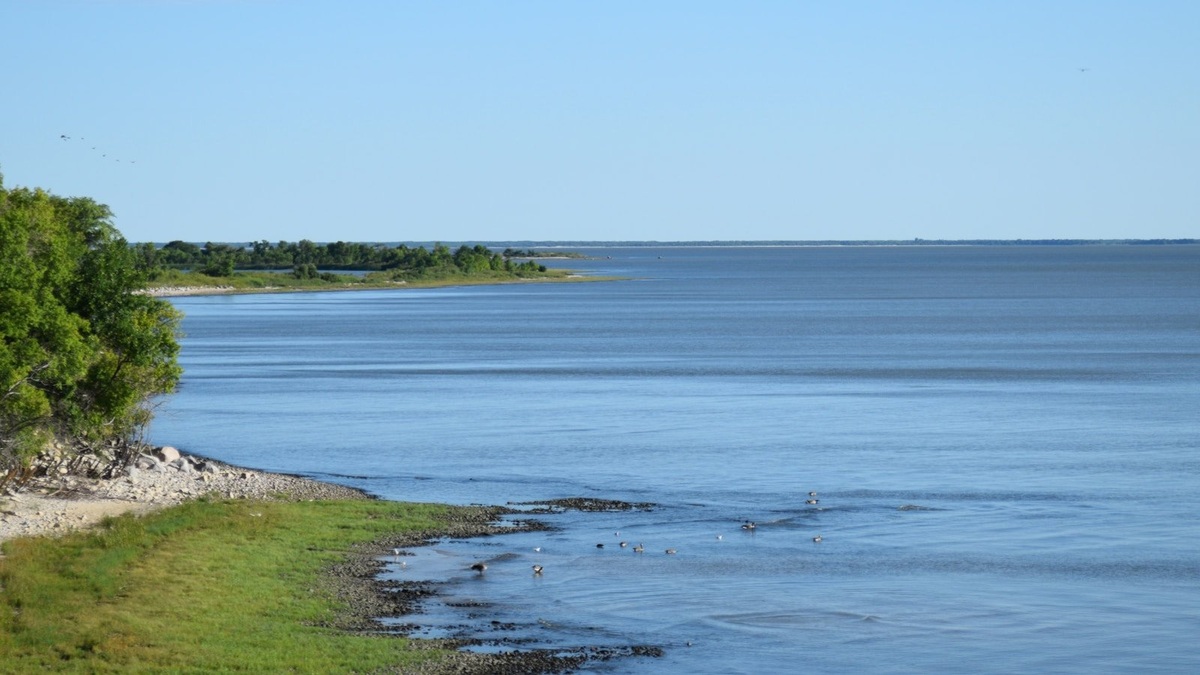
Lake Winnipeg stretches north from Manitoba’s settled southern plain into the boreal region, creating a long freshwater corridor near the geographic center of Canada. On a map, its two broad basins are joined by a narrow central passage called the Narrows. Winnipeg lies south of the lake rather than on its shore.
The Manitoba government profile gives an area of about 23,750 square kilometres, a length of 436 kilometres and a maximum width of 111 kilometres. It reports an average depth near 12 metres and a maximum near 36 metres off the northeast shore of Black Island.
Where Lake Winnipeg is
Lake Winnipeg is entirely within Manitoba. Its southern end begins about 55 kilometres north of the provincial capital, while the northern basin reaches far into the province. The lake is oriented mainly north to south and drains northward through the Nelson River toward Hudson Bay.
Major communities around the shore include Gimli and Winnipeg Beach on the southern basin. Grand Rapids stands near the Saskatchewan River entrance on the lake’s northwestern side. Many smaller communities are accessible by regional roads, ferries or seasonal routes, so a transportation map can convey access more accurately than a plain lake outline.
Argo’s overview of the largest freshwater lakes places Lake Winnipeg’s size in a global context. Surface area, depth and water volume produce different rankings.
Two basins connected by the Narrows
The lake’s southern basin is broad and relatively shallow. Manitoba reports an average depth of about 9 metres there. The northern basin is larger and somewhat deeper, averaging about 13.3 metres.
The Narrows links the two basins through a constrained central reach. Water moving north from southern tributaries must pass through this area before entering the northern basin and eventually the Nelson River. Islands and irregular shorelines make the passage look more complex on a detailed map.
A simplified state or national map may smooth the Narrows and omit small islands. Bathymetric products reveal submerged channels and basin margins that cannot be inferred from the shoreline alone.
Lake Winnipeg’s size
Manitoba lists roughly 1,750 kilometres of shoreline and a water volume near 284 cubic kilometres. The lake’s elongated form explains why its length is visually striking even though its average depth is modest.
Surface area measures the horizontal footprint. Volume combines that area with depth, while shoreline length changes with map resolution. A highly detailed coastline traces more bays and points than a generalized line, so shoreline figures from different datasets may not match.
Lake Winnipeg’s broad reach also means weather can differ sharply between its ends. A whole-lake map is suitable for regional geography, but local navigation requires current charts and conditions.
Depth and the deepest point
The maximum depth of about 36 metres is reported off the northeast shore of Black Island. Readers should treat the figure as a bathymetric measurement tied to a dataset and water-level reference rather than the distance below today’s moving surface at every moment.
Depth contours join points of equal depth. Closely spaced contours indicate a steeper underwater slope, while broad spacing suggests a gentler lakebed. Soundings are spot measurements; interpolation fills the spaces between measured lines and therefore carries uncertainty.
The federal Lake Winnipeg science highlights describe work that has improved knowledge of the lake. A high-resolution bathymetric model can support circulation studies more effectively than a decorative map.
A drainage basin far larger than the lake
Lake Winnipeg receives water from a drainage area of roughly one million square kilometres. The watershed extends across four Canadian provinces and parts of four U.S. states, according to Manitoba. Its scale dwarfs the blue lake polygon shown on a Manitoba map.
The Saskatchewan River enters from the west, while the Red River brings water north from the United States through Winnipeg. The Winnipeg River enters from the southeast. These tributaries connect prairie agriculture, forests and urban areas to the lake.
The Nelson River is the lake’s only outlet. Argo’s guide to lakes and rivers explains how inflows, storage and an outlet fit into one connected system.
What a physical map reveals
A relief map shows lowlands around the southern basin and more rugged terrain toward the north and east. The lake occupies the former bed of glacial Lake Agassiz, whose much larger footprint influenced regional soils and drainage.
Political boundaries add another layer. Although the lake itself stays within Manitoba, much of its watershed lies outside the province. A map clipped to the shoreline therefore cannot explain all sources of water or nutrients.
North arrows, scale bars and legends deserve attention. Online basemaps may rotate during use and a screen projection can alter apparent distances. Measurements should be made from a dataset with a declared coordinate reference system.
Maps for water quality
Lake Winnipeg has experienced recurring algal blooms and nutrient concerns. Water-quality maps may display sampling stations, satellite observations or modeled concentrations. Each product answers a different question and covers a particular period.
Color does not automatically represent depth. On one map, green may indicate chlorophyll concentration; on another, it may show land cover. Reading the legend prevents a thematic map from being mistaken for bathymetry.
The position of a sample is also important. Nearshore readings can reflect river plumes or local resuspension, while offshore stations represent different conditions. A dot on a small map may cover several kilometres.
How to read the official maps
Use a general reference map to locate the basins, Narrows and tributaries. Choose bathymetry for underwater form, watershed maps for drainage connections and monitoring maps for environmental measurements. Dates and metadata establish whether layers can be compared.
A technical Manitoba bathymetric report documents high-resolution modeling. Such products should be read with their vertical reference, grid size and source-survey notes intact.
Argo’s explanation of how continental ice shaped major lake basins adds glacial context, but official Manitoba and federal maps remain the primary choices for measurements and management.
What a map cannot show by itself
Shorelines, water levels and bloom conditions change. Ice can obscure the lake in imagery and generalized maps omit small channels. A map publication date therefore belongs beside any statement about present conditions.
Lake Winnipeg is best understood as a connected system. Its two basins and narrow middle define the visible form, while an immense international watershed explains how water reaches it. The Nelson River completes the route to Hudson Bay.
For travel or navigation, consult current local notices and authorized charts. The geographic overview is stable, but safe access depends on weather, ice, water level and local restrictions.
Seasonal ice changes the visible map
Winter imagery can hide the shoreline-water contrast. Snow-covered ice may resemble adjacent land, while cracks and pressure ridges remain too small for a regional satellite view. An optical image also records cloud and lighting conditions rather than bathymetry.
Ice maps have their own dates and classifications. They help describe current or recent surface conditions, but they do not replace a navigation chart or local safety advice. Comparing them with an open-water basemap requires stable control points such as islands and headlands.
Comparing measurements across editions
Keep units and reference systems together. Kilometres and miles can be converted, but rounded values will not always return the original figure. Bathymetric grids may also use different shorelines or vertical references, which affects apparent depth near the edge.
A defensible comparison cites the agency, dataset date and resolution. If two maps disagree, examine their metadata before choosing one. Differences often arise from generalization or newer source data rather than a physical change across the entire lake.
The federal Water Survey of Canada provides hydrometric access for stations in the drainage system. Station data can add current river context, although it should not be interpreted as a direct measurement of every part of the lake.





