
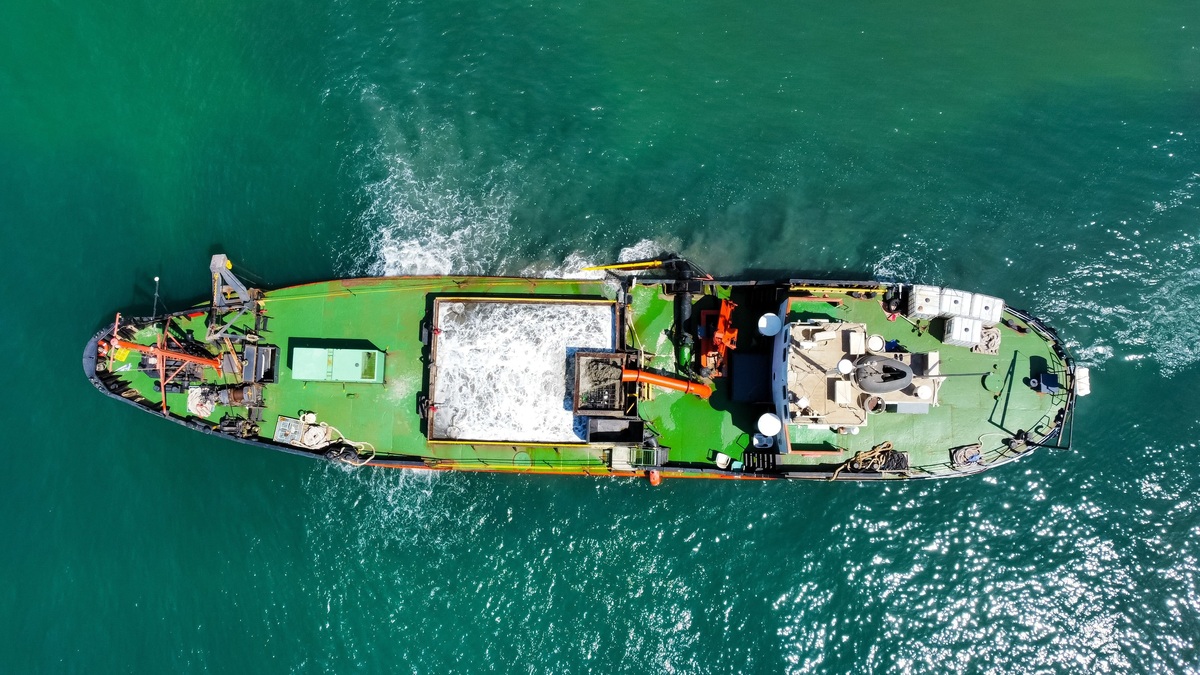
Most of the ocean remains unexplored in the strict sense of having been seen directly. NOAA says explorers have visually observed less than 0.001 percent of the deep-ocean seafloor, an area roughly comparable to Rhode Island. Mapping has progressed much further, yet it is still incomplete: as of April 2026, multibeam sonar had mapped 28.7 percent of the global seafloor to modern high-resolution standards.
The familiar claim that humans have explored only 5 percent of the ocean does not have one clear scientific definition behind it. “Explored” can mean mapped from orbit, measured with ship-mounted sonar, sampled by instruments or viewed by cameras. Each method answers a different question, so the unexplored share changes with the standard being used.
NOAA Ocean Exploration’s current accounting offers the clearest way to separate those meanings. Satellite gravity data provide a broad map of the entire seabed. Direct sonar surveys reveal much finer terrain, while cameras and submersibles show the animals and geological features present at a particular place.
Mapped does not mean explored
Satellites cannot look through miles of seawater and photograph the bottom. Instead, they measure subtle differences in sea-surface height caused by gravity. A massive underwater mountain exerts slightly more gravitational pull than the surrounding abyss, producing a small bulge in the water above it. Scientists use those signals to infer broad seafloor relief.
The resulting global map is invaluable, but it is too coarse to show many seamounts, narrow canyons or shipwrecks. A ship carrying multibeam sonar sends sound toward the bottom in a fan-shaped pattern and measures how long the echoes take to return. The travel times become depth measurements across a swath beneath the vessel.
Even a detailed depth chart describes form rather than life. It can identify a ridge that may support deep-sea coral, but it cannot establish which species occupy the ridge or how they interact. Researchers need remotely operated vehicles, autonomous vehicles, landers and physical samples to characterize a habitat. Readers interested in the material covering those landscapes can also see what ocean-floor sediment is made of.
Why the deep ocean remains so difficult to see
The ocean covers about 360 million square kilometers, or 139 million square miles and averages 3,682 meters deep. More than 90 percent of it qualifies as deep ocean, meaning water deeper than 200 meters. Sunlight fades rapidly below the surface, temperatures fall and pressure rises by roughly one atmosphere for every 10 meters of descent.
Survey ships must travel back and forth across immense areas to collect high-resolution sonar, a pattern crews sometimes call mowing the lawn. Deep water lets a sonar beam cover a wider strip, but remote expeditions require fuel, specialized crews and long stretches of ship time. Shallow coastal waters create a different problem because each pass covers less bottom and navigation hazards can complicate the work.
Direct observation is slower still. A remotely operated vehicle may spend hours descending before its cameras reach the seabed. Its field of view is tiny compared with an ocean basin. Strong currents, steep terrain and the need to recover samples safely constrain where it can go. A dive can document a habitat beautifully while leaving the next valley unseen.
The latest seafloor numbers
The best global figure should always include a date. NOAA reported that 28.7 percent of the global seafloor met modern high-resolution mapping standards in April 2026. The remainder, about 71.3 percent, still lacked coverage at those standards even though satellite-derived estimates exist for all of it.
National figures differ because survey effort is uneven. NOAA’s Integrated Ocean and Coastal Mapping program reported that 44 percent of U.S. coastal, ocean and Great Lakes waters remained unmapped at the relevant resolution in January 2026. Alaska and the U.S. Arctic retain particularly large gaps, while the Pacific waters off California, Oregon and Washington have much greater coverage.
Progress also includes older data that institutions discover and release, not solely new ship surveys. A depth sounding stored by a navy, research institute or commercial vessel may become useful once its quality is checked and the data are shared. Combining compatible records prevents survey ships from repeating work unnecessarily.
Seabed 2030 is building a common map
The Nippon Foundation and the General Bathymetric Chart of the Oceans launched the Seabed 2030 project in 2017. Its goal is to assemble available bathymetric measurements into a definitive public map of the world ocean floor. Regional centers collect data, check their quality and feed them into the global GEBCO grid.
The project’s target resolution changes with depth. A grid cell can be larger in the deepest ocean than in coastal water because survey physics and practical needs differ. Reaching the target also depends on nations, scientists and private operators sharing observations that may already exist. Fishing vessels and other ships can contribute suitable depth data through crowdsourced bathymetry programs.
A complete baseline map will not make exploration finished. Earthquakes, eruptions and landslides continue altering the bottom. Habitats change as currents shift and organisms move. Mapping supplies the framework for choosing where closer observation is likely to answer the most useful questions.
The earlier NCEI mapping overview described how researchers prioritize gaps instead of sending ships out at random. Existing tracks, expected terrain and the needs of navigation or hazard planning all influence where limited survey time goes. That strategy becomes more important as the easiest routes are completed and remaining gaps shift toward remote water.
What better maps are used for
Seafloor shape influences currents and tides by steering moving water. It controls where sediment accumulates and helps determine which slopes can support particular bottom communities. Bathymetry therefore connects physical oceanography with the biological work described in marine biology and oceanography.
Accurate depths also improve tsunami models. A tsunami changes speed and height as it enters shallower water, so emergency planners need a reliable picture of offshore terrain and coastal channels. Nautical charts, submarine cable routes and offshore construction depend on the same basic measurements. Previously unknown pinnacles can pose direct hazards to ships operating beneath the surface.
Maps guide discovery by highlighting places that differ from their surroundings. An isolated seamount, a canyon wall or a hydrothermal field may become the target of a camera dive. The map shows where to look; instruments then measure chemistry and collect samples, while images reveal the living community.
How much is truly unknown
No single percentage captures every kind of ocean knowledge. Nearly the whole surface is observed regularly by satellites. The broad form of the seafloor is globally inferred, just over one-quarter has modern high-resolution sonar coverage and far less of the deep bottom has been visually examined.
Biological uncertainty is equally large. NOAA estimates that the ocean may contain 700,000 to 1 million species when most microorganisms are excluded, with perhaps two-thirds still undescribed. Finding a species once does not reveal its full range, abundance or ecological role. Even familiar waters can yield organisms that science has not formally named.
The most accurate short answer is therefore that more than 99.999 percent of the deep seafloor has not been directly seen, while roughly 71 percent of the global seabed still lacks modern high-resolution mapping. Those figures measure different stages of discovery. Together they explain why the ocean remains Earth’s largest accessible frontier.
Neither number should be read as a claim that scientists know nothing about the rest. Floats, satellites and water samples reveal circulation or chemistry far beyond camera tracks. A place can be well measured for temperature yet never photographed at the bottom, which is why any honest percentage must name the kind of exploration it counts.





