
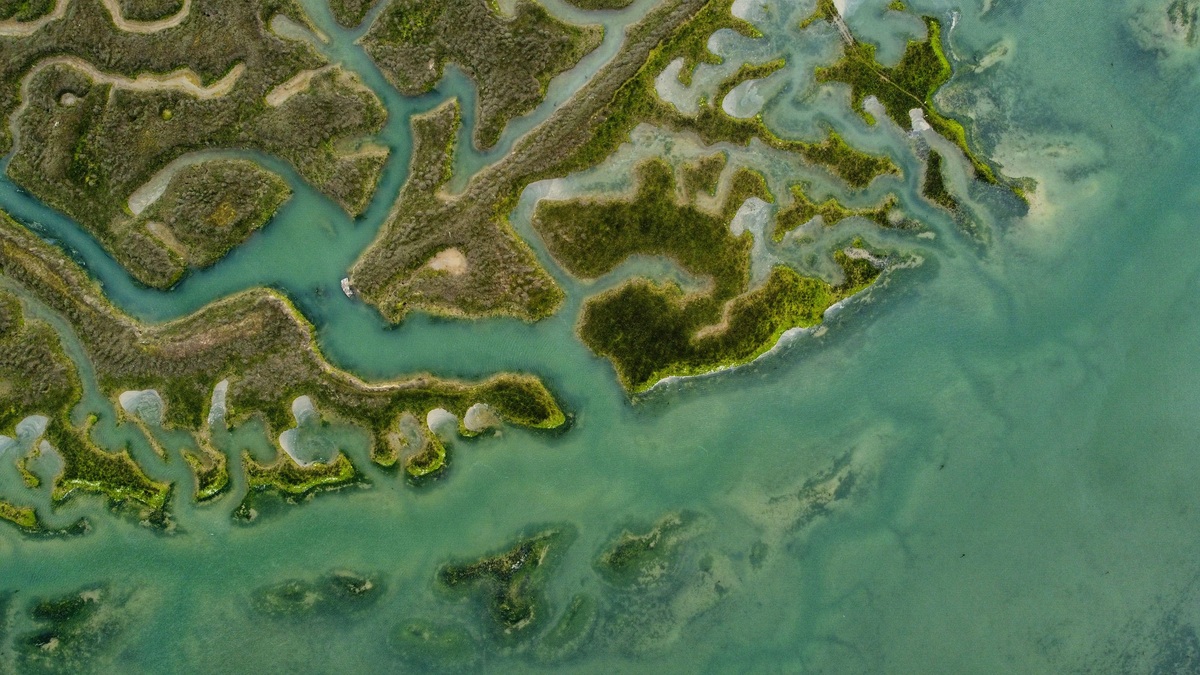
Estuary salinity zones divide the transition from river water to seawater into named concentration ranges. In a common system, tidal fresh water is below 0.5 parts per thousand. Oligohaline water spans 0.5 to 5, mesohaline water 5 to 18, polyhaline water 18 to 30 and euhaline water approaches open-ocean salinity.
The boundaries help scientists compare habitats and track change, but the zones move. Rainfall can push fresher conditions toward the sea, while drought lets salt travel farther upstream. Tides shift the pattern over hours and wind may pile water into one part of an estuary.
The U.S. Geological Survey’s Biscayne Bay research shows why the freshwater supply matters. The volume of inflow sets the immediate dilution, while its timing controls when fresher conditions arrive. A change in the source can alter where that water enters. Together, these shifts affect bay salinity and can influence the ecosystem over decades.
How salinity is measured
Salinity describes the concentration of dissolved salts. Estuary monitoring programs often report parts per thousand or a closely related practical salinity value derived from electrical conductivity. Open-ocean water averages near 35 parts per thousand, while river water approaches zero.
Temperature affects conductivity, so instruments apply a correction. A monitoring station records conductivity alongside the temperature needed for that adjustment. Its installed depth identifies the sampled layer. Researchers also lower profilers from boats to measure how salinity changes from the surface to the bottom.
A map built from equal-salinity contour lines is called an isohaline map. NOAA explains that the shape of these lines reveals the degree of mixing within an estuary. Closely spaced contours show a sharp salt front, while broader spacing indicates a gradual transition.
Measurements must cover both distance and depth. A surface-only survey can miss a bottom salt wedge, while one fixed station cannot show the upstream gradient. Monitoring designs combine repeated profiles with continuous sensors to capture the moving three-dimensional field.
Quality checks keep sensor drift from appearing as a false movement of the salt front.
Tidal fresh water below 0.5 ppt
The upper estuary may rise and fall with the tide while remaining almost entirely fresh. This tidal fresh zone lies below about 0.5 ppt in the widely used Venice salinity system. Its water still reverses direction or backs up as the ocean tide moves inland.
Tidal freshwater wetlands support plants poorly suited to salt exposure. Their flooding rhythm differs from a nontidal river, creating habitats that combine river chemistry with coastal water-level changes.
The zone’s downstream edge shifts with river discharge. A wet spring can extend it toward the estuary mouth. During drought, the salt front may advance upstream and expose freshwater communities or drinking-water intakes to higher chloride levels.
Oligohaline water from 0.5 to 5 ppt
Oligohaline means slightly salty. The zone begins where marine influence becomes ecologically meaningful but salinity remains far below seawater. It often contains the moving boundary between freshwater species and organisms adapted to brackish conditions.
Small salinity increases can alter plant communities and the behavior of dissolved substances. Fine sediment may clump as river water encounters salt, helping create a turbidity maximum near the landward part of an estuary.
The San Francisco Estuary study used salinity guilds to examine 33 years of fish records. Its ranges differed somewhat from the standard zone boundaries, illustrating why every analysis should state its definitions.
Mesohaline water from 5 to 18 ppt
The mesohaline zone occupies the middle of the salt gradient. Salinity is high enough to exclude many freshwater organisms, yet still low and variable compared with the ocean. Tidal changes can be substantial in narrow or shallow systems.
Oysters often inhabit mesohaline parts of estuaries because suitable salinity can reduce some marine predators and diseases while remaining high enough for feeding and growth. Temperature modifies their tolerance, which also changes with life stage. Local conditions determine how those limits appear at a particular reef.
Density layering may become pronounced where fresher surface water flows seaward above a saltier bottom current. A strong vertical gradient can reduce oxygen exchange with bottom water. Wind and tidal turbulence may periodically mix the layers.
Nutrients arriving from the watershed pass through this zone while plankton transform or consume them. Residence time influences whether nutrients move quickly to the coast or support blooms within the estuary.
Polyhaline water from 18 to 30 ppt
Polyhaline water is strongly saline but remains measurably fresher than typical open-ocean water. It usually occurs nearer the mouth, where tidal exchange supplies seawater and river dilution has a smaller effect.
Marine fish and invertebrates increasingly dominate. Many species use this zone as a nursery, taking advantage of sheltered water and abundant food before moving offshore. Salinity still changes enough to sort species by tolerance.
Coastal drought can expand the polyhaline zone inland. USGS developed a Coastal Salinity Index to describe unusually salty or fresh conditions over time, providing context that a single salinity measurement cannot offer.
Euhaline and hyperhaline water
Euhaline water generally spans about 30 to 40 ppt and resembles the sea. NOAA’s simpler national mapping scheme calls water at or above 25 ppt the seawater zone, so a location may receive different labels under different systems.
Hyperhaline water exceeds about 40 ppt. It develops where evaporation removes water faster than freshwater inflow and ocean exchange can replace it. Shallow restricted bays in dry climates are especially susceptible.
High salinity changes the species present and lowers oxygen solubility. Severe evaporation may also concentrate pollutants or nutrients. Managers track the full water balance rather than assuming salt comes only from an incoming tide.
Why the zones move
River discharge is the largest landward control. NOAA notes that estuary salinity commonly falls during wet spring conditions and rises in summer as freshwater flow declines and evaporation increases.
Tides move salt upstream on the flood and back toward the sea on the ebb. The salt front may travel farther along the bottom because seawater is denser. Wind modifies the pattern by driving surface water and changing vertical mixing.
Bathymetry and shoreline shape determine where water accelerates or pools. Channels carry salty bottom water inland, while shallow shoals mix more readily. Modifying an inlet can alter exchange with the sea. Canals change the freshwater route and managed delivery changes its timing. Each intervention can shift the long-term position of a salinity zone.
How the zones are used
Salinity zones help map fish habitat across an estuary. Wetlands and submerged vegetation can be compared with the same gradient. The zones guide placement of monitoring stations and reveal whether a biological change may reflect altered freshwater flow. A species range can be compared with the moving salt field rather than a fixed geographic line.
NOAA’s national dataset uses three long-term zones: tidal fresh from 0 to 0.5 ppt, mixing from 0.5 to 25 and seawater at 25 or above. The 147-estuary archive warns that this static picture does not capture seasonal movement.
Good interpretation pairs the zone name with the numeric range and sampling period. Estuary salinity zones are useful because they translate a continuous gradient into ecological regions, but the living boundary keeps responding to river flow and the sea.
Long-term stations reveal how often a site crosses a zone boundary. A location labeled mesohaline on an annual map might become oligohaline after storms and polyhaline during drought. Frequency distributions preserve that variability better than a single average. They also show whether extreme salty or fresh episodes last hours, weeks or an entire season, which determines how much biological exposure occurs.
Climate-driven sea-level rise can also shift salt landward, but river management and channel deepening may produce comparable local effects. Researchers compare salinity with the water-level record, then assess the river discharge present during each observation. The salinity zones provide a shared vocabulary while the measurements supply the evidence. A documented method allows later surveys to test whether each boundary truly moved over years rather than merely following one tide.
Related reading: the difference between an ocean and a sea and how saltwater lakes form.





