
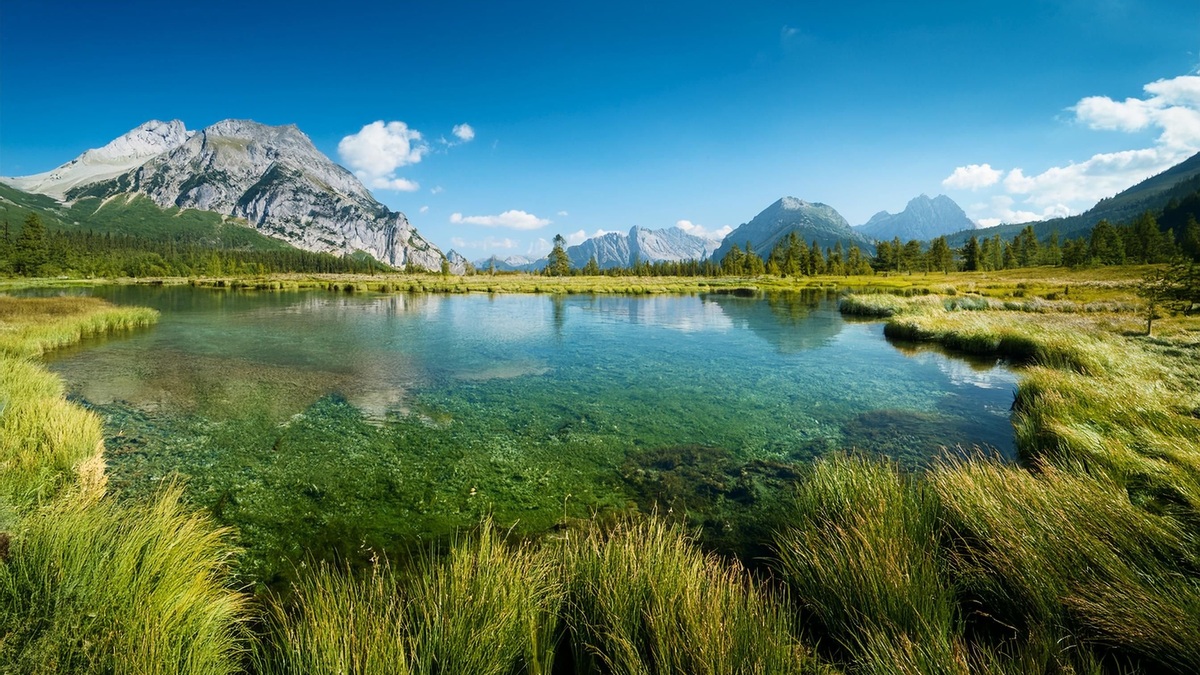
Oligotrophic lakes have low biological productivity, while eutrophic lakes have high biological productivity. In practice, an oligotrophic lake usually has fewer algae, clearer water and more oxygen in deep water. A eutrophic lake usually supports more algae and aquatic plant growth, has lower clarity and faces a greater risk of deep-water oxygen depletion.
The terms describe trophic state, not a simple ranking from good to bad. A naturally productive shallow lake can support abundant wildlife and a clear lake can still have pollution or unsafe fish. Scientists classify trophic state with measurements such as chlorophyll a, phosphorus and water transparency, interpreted for the lake’s region and type.
The central difference is productivity
Primary productivity is the rate at which algae, cyanobacteria and aquatic plants build organic matter through photosynthesis. Nutrient-poor water limits that growth in an oligotrophic lake. Greater nutrient availability supports more production in a eutrophic lake.
EPA’s National Lakes Assessment uses chlorophyll a, the photosynthetic pigment measured in water, to place lakes into nationally consistent trophic categories. Its 2022 report classifies concentrations at or below 2 micrograms per liter as oligotrophic, above 2 through 7 as mesotrophic, above 7 through 30 as eutrophic and above 30 as hypereutrophic.
Those cutoffs belong to one assessment framework. States and researchers may use different thresholds or combine chlorophyll with total phosphorus and Secchi transparency. A classification should therefore name the metric and method instead of presenting a trophic label as a universal visual judgment.
How the two lake types usually look
Oligotrophic lakes are often deep, cold and clear, with rocky or sandy bottoms visible through the nearshore water. Low algal biomass allows light to penetrate farther. Sparse production means less dead organic material settles into the deep basin.
Eutrophic lakes are commonly greener or murkier because phytoplankton are abundant. Rooted plants may grow densely where light still reaches the bottom. Fine sediment rich in decomposing organic matter often accumulates in sheltered areas.
Appearance has limits. Brown dissolved organic matter can darken a nutrient-poor lake, producing a dystrophic condition that does not fit the blue-versus-green shorthand. Suspended mineral sediment can make water cloudy without high algal production. The USGS Lake Trophic State dataset recognizes nutrient, algal and water-color combinations that go beyond two categories.
A single photograph cannot establish trophic state. Water samples and repeated clarity measurements distinguish algae from sediment or dissolved color. Seasonal timing matters because a clear spring sample may precede a summer bloom.
Why deep-water oxygen differs
Summer heating can separate a lake into warm surface water and a colder deep layer. The density boundary restricts mixing. Organisms continue to respire below it, while bacteria consume oxygen as they decompose sinking organic matter.
An oligotrophic lake sends less organic material downward, so deep oxygen generally lasts longer. Cold water can retain habitat for oxygen-demanding fish through more of the summer. The exact outcome depends on basin shape, water residence time and the strength of seasonal mixing.
A eutrophic lake supplies decomposers with more dead algae and plant material. Oxygen can fall sharply in the isolated bottom layer. If anoxic water contacts sediment, chemical conditions may release previously bound phosphorus, reinforcing productivity after the lake mixes again.
Fish kills are a risk, not a defining requirement. Many eutrophic lakes retain enough oxygen for fish in part of the water column. Severe losses occur when oxygen demand, stratification, heat or a large die-off leave too little suitable habitat.
Where nutrients come from
Phosphorus often limits algal growth in freshwater, although nitrogen, light or grazing can limit production in particular lakes and seasons. Nutrients arrive naturally from soil, weathering, groundwater, streams, wildlife and decomposing organic matter.
Human activity can accelerate the supply. Fertilizer, manure, eroding soil, leaking septic systems and wastewater carry nutrients into lakes through runoff or tributaries. Urban stormwater moves material quickly from hard surfaces. Atmospheric deposition adds nitrogen to some watersheds.
USGS describes eutrophication as the physical, chemical and biological change associated with nutrient, organic-matter and silt enrichment. Natural enrichment can unfold over centuries or millennia. Cultural eutrophication compresses the process when human nutrient inputs rise.
Mesotrophic and hypereutrophic lakes
Mesotrophic lakes occupy the middle of the productivity range. They generally have moderate algae, plant growth and clarity. The label is useful because many lakes do not resemble either an extremely clear alpine lake or a bloom-prone shallow basin.
Hypereutrophic lakes sit above the eutrophic range, with extreme primary production and frequent water-quality problems. EPA connects human-accelerated hypereutrophy with nuisance algae, excessive plant growth, odor, low oxygen and fish kills. Only some cyanobacterial blooms produce toxins.
Trophic states form a continuum. Boundaries make monitoring results easier to communicate, yet a lake close to a cutoff is not ecologically transformed by crossing one numerical line. Trends across several years are usually more informative than one category assigned from one sample.
How trophic state is measured
Chlorophyll a estimates the abundance of photosynthetic microorganisms. Total phosphorus measures dissolved and particle-bound forms in a sample. A Secchi disk measures transparency by recording the depth at which a contrasting disk disappears from view.
Each indicator answers a different question. High phosphorus suggests capacity for growth, chlorophyll shows an algal response and transparency reflects algae plus other light-blocking material. Comparing all three can reveal whether suspended sediment or dark dissolved matter is distorting a clarity-based estimate.
Sampling depth and season must be consistent. A surface sample taken during a bloom cannot represent an annual average and a deep sample below the mixed layer measures different conditions. USGS lake-sampling guidance explains how trophic indicators fit within broader physical and chemical study design.
For ecological context, Argo’s guide to aquatic food chains follows the energy produced by algae and plants into consumers. Trophic state describes how much production occurs; the food web describes where that energy moves.
Can a eutrophic lake become less productive?
Reducing external nutrient loads is the foundation of recovery. Watershed measures may include erosion control, improved manure and fertilizer practices, septic maintenance and better wastewater treatment. The relevant sources differ among lakes, so monitoring and a nutrient budget should guide action.
Recovery can be slow because phosphorus stored in sediment may continue cycling into the water. A lake’s residence time determines how quickly incoming water replaces existing water. Food-web changes and invasive species can also affect algal biomass without changing nutrient input in a simple proportion.
Management aims for an appropriate state, not universal oligotrophy. Forcing a naturally productive shallow lake to resemble a deep mountain lake is neither realistic nor ecologically sound. Regional reference lakes and historical evidence help define attainable conditions.
What the label can and cannot tell you
Trophic state predicts broad patterns in algae, clarity and oxygen. It helps managers compare lakes and track nutrient responses. It does not certify drinking-water safety, swimming conditions or whether fish are safe to eat.
Local advisories remain essential. EPA’s national report separates trophic indicators from cyanotoxins, fecal contamination and contaminants in fish tissue. A lake can be oligotrophic yet have a harmful contaminant, while a eutrophic lake can be safe for recreation on a particular day.
Readers comparing water bodies should also separate lake productivity from lake size or origin. Argo’s lake-versus-pond guide explains why depth and mixing often matter more than the name. Oligotrophic and eutrophic remain useful terms when tied to measured productivity, a stated method and the conditions of the whole lake.
Repeated measurements provide the clearest interpretation because trophic indicators can move across category boundaries with season, weather and sampling location.





