
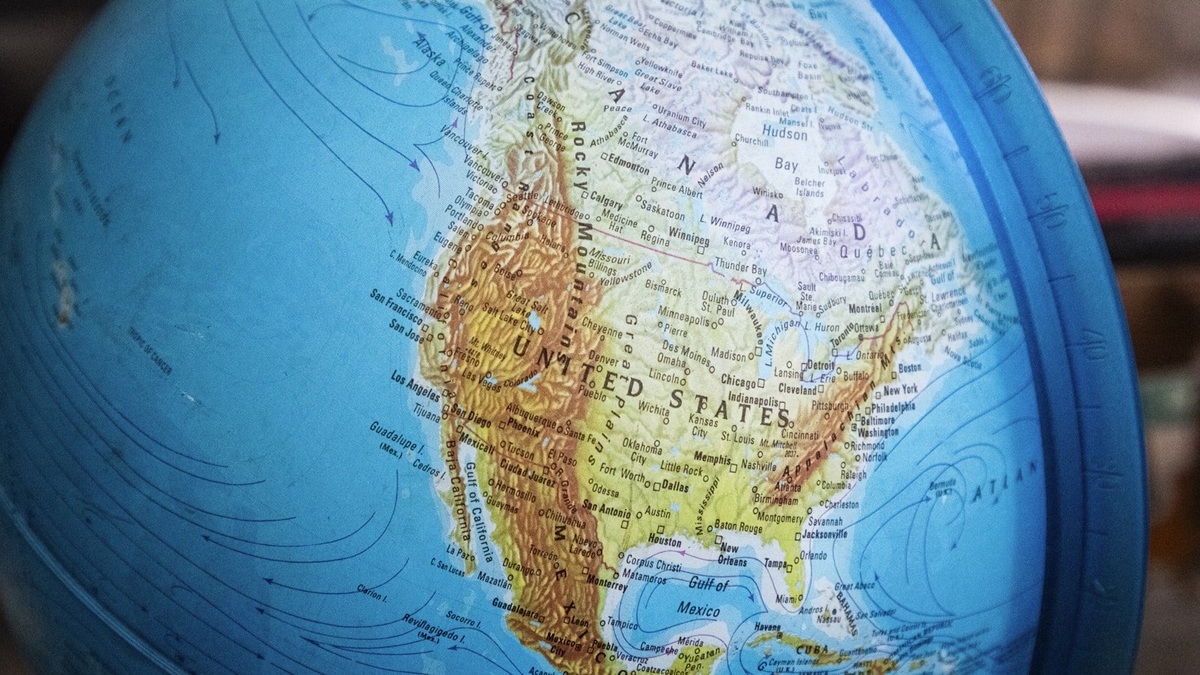
The best continental map of North America’s major rivers and lakes is the Commission for Environmental Cooperation’s North American Lakes and Rivers, 2023. It combines coastlines, major linear waterways and major lake or reservoir polygons across Canada, the United States and Mexico in one harmonized dataset.
The map’s reference scale is 1:1,000,000. It is designed for continental and regional viewing, not property boundaries, paddling routes or flood decisions. The CEC page offers an interactive viewer, a PDF and downloadable GIS files, making it more useful than an unlabeled image copied without metadata.
What the continental map actually shows
Linear features include major rivers, streams and canals. Area features include major lakes and reservoirs. The dataset also carries the coastline, which makes it easier to follow watersheds from interior headwaters toward the Atlantic, Pacific, Arctic Ocean or internally drained basins.
Version 4 corrected remaining topology errors from the previous version. “Topology” describes how mapped lines and polygons connect. Fixing a gap or overlap improves network continuity, but it does not make a one-million-scale river line suitable for locating a backyard stream.
The CEC says the harmonized source products came from Natural Resources Canada, the USGS, Mexico’s INEGI and Mexico’s CONAGUA. Continental integration matters because national datasets use different schemas and mapping conventions at their borders.
Reading North America’s drainage pattern
Across the center of the continent, the Mississippi-Missouri system gathers water from a vast area before reaching the Gulf. The Great Lakes connect eastward through the St. Lawrence River. Argo’s guide to how the Great Lakes are connected explains the sequence of lakes and connecting channels that a small-scale map compresses into a few lines.
Western drainage looks more fragmented. The Colorado reaches toward the Gulf of California, while the Columbia crosses the international boundary and enters the Pacific. Mountain ranges divide short coastal rivers from long interior systems. Closed basins in the Great Basin and Mexico end in lakes, playas or wetlands rather than reaching an ocean.
Canada, the United States and Mexico belong on the same map
Canada contains an immense share of the continent’s mapped lake area. Great Bear Lake and Great Slave Lake drain through the Mackenzie system toward the Arctic Ocean, while Lake Winnipeg drains north through the Nelson River to Hudson Bay. The Laurentian Great Lakes cross the Canada-US boundary and form the world’s largest connected freshwater-lake system by area.
The United States contains the broad Mississippi network, large western reservoirs and countless smaller waters omitted at this scale. Mexico adds the Río Bravo or Rio Grande border system, the Lerma-Santiago basin and major lakes such as Chapala. A “North America” map that stops at the US-Mexico boundary gives an incomplete picture of continental hydrology.
Names can change at borders. The Rio Grande is commonly called Río Bravo del Norte in Mexico. A harmonized map may select one label or preserve national attributes in the downloadable data. The underlying watercourse remains continuous even when language and administrative datasets change.
Natural lakes and reservoirs need different interpretation
A blue polygon can represent a tectonic lake, a glacial basin or water impounded by a dam. At continental scale, all three communicate surface-water geography. For questions about origin or management, however, the distinction is essential. Reservoir shorelines can fluctuate rapidly with operations, while natural-lake levels respond to their water balance and may also be regulated at an outlet.
Large-area comparisons require a consistent rule for border waters and connected basins. Argo’s list of the largest lakes in North America discusses surface area, while a river map emphasizes network position. Neither ranking should be inferred merely from symbol size in a generalized PDF.
Scale determines which waterways disappear
At 1:1,000,000 scale, one centimeter on a printed map represents roughly ten kilometers on the ground. Fine tributaries, narrow channels and small ponds would overwhelm the page if all were retained. Cartographers select and simplify features so that the largest drainage patterns remain legible.
Cartographic generalization can shift a line slightly or smooth a shoreline. Canals may also resemble rivers unless the legend separates them. Anyone analyzing a local watershed should move from the CEC atlas to higher-resolution national data such as the USGS National Hydrography products, Natural Resources Canada’s hydrology data or the corresponding Mexican agency layers.
A practical way to use the map
Use the interactive viewer first to trace a major river or compare lake regions across borders. Open the PDF when a stable, legible overview is enough. Download the shapefile or map package when you need to style features, inspect attributes or combine hydrography with elevation and political boundaries in GIS.
For changing conditions, a static atlas is only the locator. Live gauges and agency forecasts supply current levels or flows. Argo’s Great Lakes conditions page illustrates the difference between enduring geography and time-stamped observations.
The map is strongest when used at its intended scale: a seamless continental overview of major water features. Its metadata explains what was selected, which agencies contributed source data and why small local waters may be absent.
Major continental divides organize the network
The Continental Divide separates much of the water reaching the Pacific from drainage toward the Atlantic and Gulf. Farther north, the Arctic Divide sends water toward the Mackenzie system and other Arctic outlets. Hudson Bay receives an immense interior drainage of its own. These high-ground boundaries are clearest when a hydrography layer is paired with elevation or watershed polygons.
Not every basin reaches a coast. Great Salt Lake and many basins of northern Mexico terminate inland, where evaporation balances inflow over long periods. Their rivers may vanish into lakes, marshes or dry playas. A continental map should therefore avoid drawing every network as though it must connect to an ocean.
River capture, canals and diversions complicate the natural pattern. The Chicago Sanitary and Ship Canal links the Great Lakes watershed with the Mississippi system, while irrigation diversions can move water across local divides. The CEC dataset includes major canals, but the PDF’s linework alone may not reveal whether a connection is natural or engineered.
Downloadable data support better questions
The shapefile allows a GIS user to select features by type, inspect names and overlay political boundaries. Projection choice matters across a continent because distance and area distortion varies dramatically from Mexico to the Canadian Arctic. An equal-area projection is preferable for area comparisons; a conformal map can be better for local shapes.
Metadata should travel with any exported map. It records the 2023 edition, version, reference scale and contributing agencies. Removing those notes can make generalized lines look more precise than they are. The official package also provides a reproducible source when a map is updated later.
A basin-level study should use watershed polygons rather than guess drainage from the nearest blue line. A navigation project requires official charts. Flood analysis needs elevation and hydraulic data. The CEC atlas remains the right opening view because it supplies consistent cross-border context before the user moves to a more detailed national dataset.
Lake and river labels also reflect selection at the reference scale. Absence of a name does not mean that a feature is unnamed in national records and a displayed name may have approved variants in Indigenous or national languages. Users preparing a public map should consult the relevant naming authority before replacing official local usage.
Edition dates protect the map’s meaning
Changes between atlas editions may reflect improved geometry or source integration rather than a physical change in the water body. Conversely, reservoirs and shifting terminal lakes can change after the source imagery was compiled. The edition date describes the dataset, while a live hydrologic service describes present conditions. Both dates belong in a serious map caption.
National follow-up sources include the Atlas of Canada and Mexico’s INEGI hydrography portal. Using the national source behind a feature can expose finer geometry and local naming that the harmonized continental layer intentionally simplifies.
For any derivative graphic, cite the CEC dataset edition and the national authority used for detail. Readers can then reproduce the map and understand why the same river may look different at two scales.





