A study in Communications Sustainability found that the world’s top 10% of consumers may be linked to $1.7 trillion to $5.7 trillion in environmental damage each year. The analysis, led by researchers at Leiden University, translates high-end consumption into a planetary bill measured in 2017 U.S. dollars.
The finding gives a stark financial shape to a familiar climate and nature problem. A relatively small share of consumers carries a large share of the footprint tied to carbon dioxide emissions, biodiversity loss, nitrogen and phosphorus flows and freshwater use.
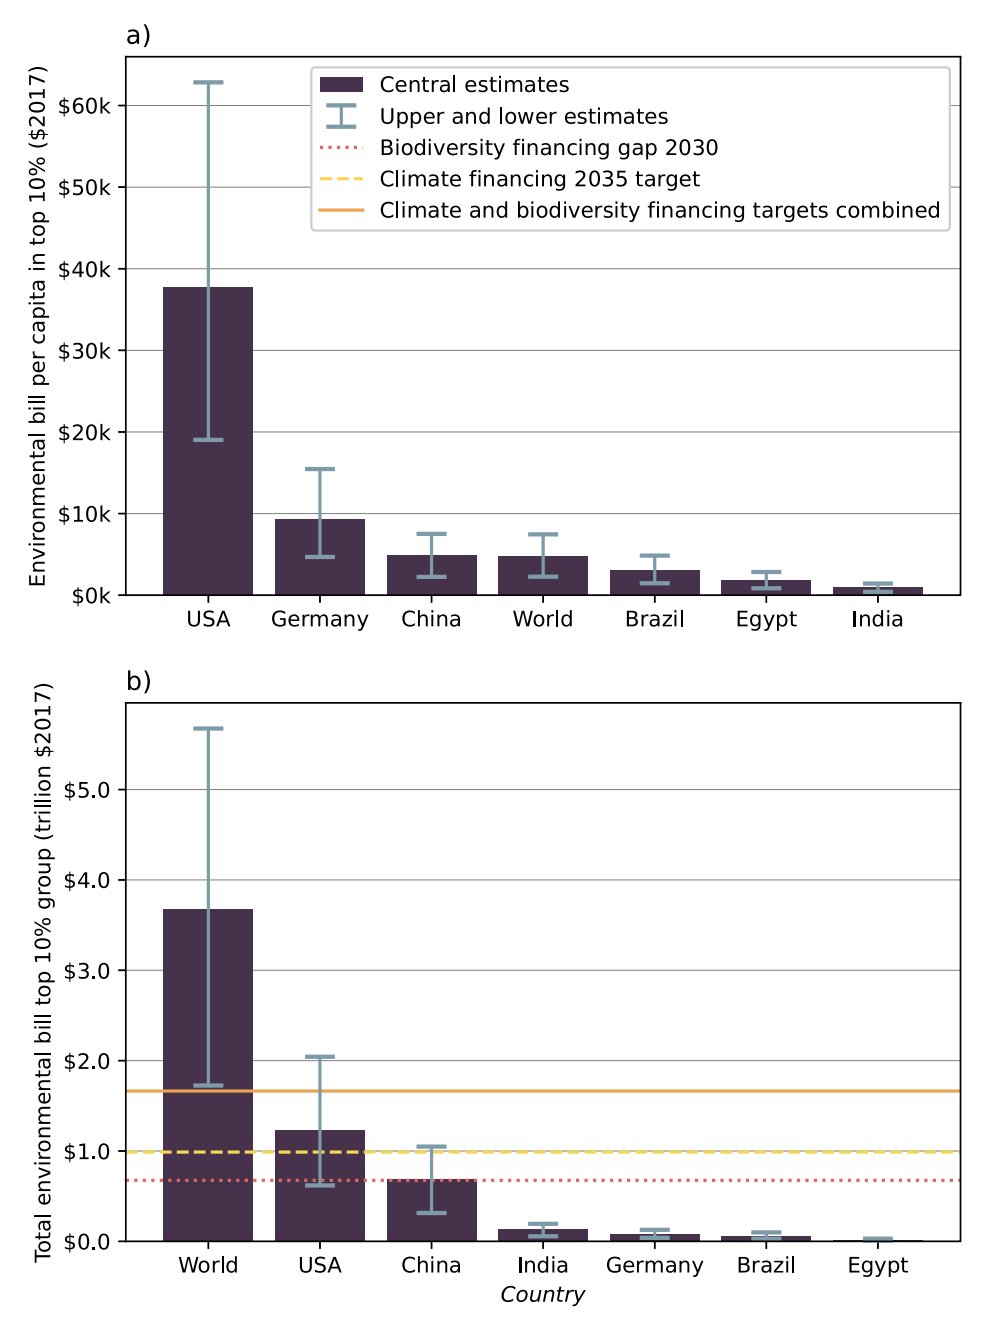
Inge Schrijver, Rutger Hoekstra and Paul Behrens calculated that annual damages for the global top decile amount to about $2,300 to $7,500 per person. For the highest-spending consumers in the United States, the estimated bill rises sharply, reaching $19,000 to $63,000 per person each year.
The numbers are intended to show the scale of environmental responsibility carried by high consumption. They also suggest how targeted environmental pricing could raise funds for climate action, biodiversity protection and broader sustainability transitions.
Scientists Put a Price on High-End Consumption
Researchers at Leiden University began with a simple question that carries enormous consequences. What would the environmental damage caused by the world’s highest-consuming 10% look like as an annual bill?
To answer it, the team brought together consumption-based environmental footprints and monetary estimates of damage. Those footprints describe the impacts associated with what people consume, rather than only what happens inside a country’s borders.
The study focused on several major pressure points in the Earth system. These included climate change, biodiversity loss, nitrogen pollution, phosphorus pollution and freshwater use. Together, they represent some of the ways human activity is pushing planetary systems into dangerous territory.
Putting a price on nature is always uneasy. Ecosystems have value that reaches beyond markets, income and accounting. Even so, monetary estimates can make the scale of damage more visible in the same language used in policy budgets, tax debates and international finance.
The researchers describe the result as an environmental bill. It represents damage borne by society through impacts such as warming, ecosystem degradation, nutrient pollution and stressed water systems.
The Global Bill Reaches Trillions
The global total is huge. The study estimates that the top 10% of consumers owe between $1.7 trillion and $5.7 trillion in annual environmental damages.
Per person, that works out to a yearly bill of about $2,300 to $7,500 among the global top decile. The range comes from uncertainty in environmental prices and damage estimates. The authors used low, central and high values to avoid a single false sense of precision.
In the study abstract, the authors write, “This surpasses international climate and biodiversity financing gaps.” That comparison matters because global negotiations often stall over who should pay for the transition to safer energy systems and better ecosystem protection.
The bill is large enough to compete with major funding targets. According to the study, even the lower global estimate matches the combined biodiversity and climate financing targets used as a reference in the analysis.
This framing turns a diffuse environmental burden into something closer to an invoice. It shows how consumption at the top of the spending ladder can create costs that are paid through heat damage, lost species, degraded ecosystems and future risks.
Why the United States Stands Out
The United States top decile has the highest estimated per-person bill in the analysis. The study places annual damage for the top 10% of U.S. consumers between $19,000 and $63,000 per person.
That range equals about 6% to 20% of their income, or 0.8% to 3% of their wealth. The result reflects high consumption levels and the large role of U.S. consumers within the global top decile.
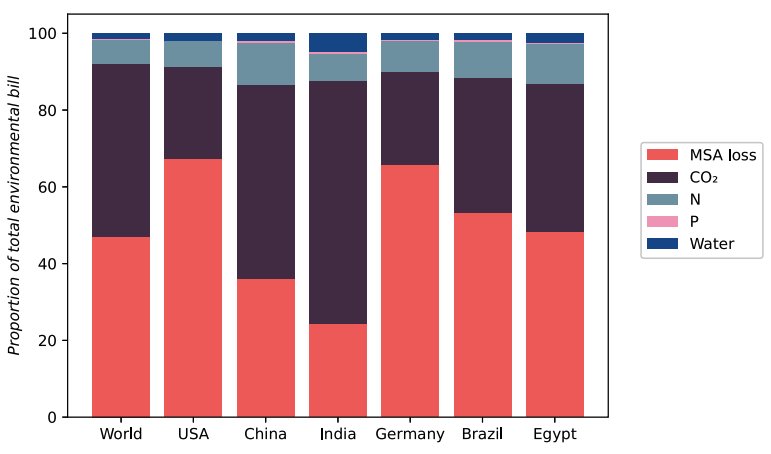
Country differences are central to the study. The researchers examined the world as a whole and six countries: Brazil, China, Egypt, Germany, India and the United States. These countries were selected as major economies or as large economies within their regions.
India shows a much lower top-decile bill by comparison. The study estimates $410 to $1,400 per person for the top 10% of Indian consumers. That equals about 0.8% to 2.8% of income, or 0.2% to 0.5% of wealth.
The contrast reflects global inequality in consumption. The top 10% within each country does not always overlap with the global top 10%. More than 60% of the global top decile is located in the United States and the European Union, while about 2% is located in India, according to the study.
Biodiversity and Climate Drive the Damage
Two parts of the bill dominate the total. The authors report that biodiversity loss accounts for 47% to 56% of the global damage bill, while climate change accounts for 36% to 45%.
The study abstract states, “The two biggest contributors to the damage bill are biodiversity loss at 47 – 56% of the total and climate change at 36 – 45%.” That short sentence captures one of the study’s most important findings.
Biodiversity loss can sound abstract, yet it describes real damage to living systems. It includes declines in ecological integrity that can weaken food webs, reduce resilience and erode the natural systems that support human wellbeing.
Climate change carries its own bill through heat, storms, sea-level rise, crop losses, health burdens and damage to infrastructure. In this study, carbon dioxide emissions are only one piece of the environmental accounting, although they remain a major one.
Nitrogen is the next largest contributor, making up about 6% to 8% of the global bill. Freshwater use and phosphorus each make up less than 2% in the global estimates. Their smaller financial share in this analysis should be read alongside the study’s chosen boundaries and available data.
How Researchers Calculated the Bill
The team started with the most recent available consumption-based footprints for the world’s wealthiest 10% of consumers. Those footprints are from 2017, which is why the study converts damage estimates into 2017 U.S. dollars.
Each footprint represents pressure on a planetary boundary. Carbon dioxide emissions were used for climate change. Mean Species Abundance loss was used for biosphere integrity. Nitrogen, phosphorus and freshwater use were also included.
To translate those impacts into money, the researchers used environmental prices from the Environmental Prices Handbook 2024. The handbook provides monetary values for environmental damage, including impacts on human health and ecosystems.
The researchers then scaled the prices for different countries based on gross domestic product per person. Carbon dioxide was treated differently, with one constant price across countries. This means each country has its own environmental prices for several categories.
The final bill was calculated by multiplying each top-decile footprint by the matching environmental price. The researchers summed the results to produce per-person bills and total bills for the whole top-decile group.
What Environmental Taxes Could Pay For
The study frames the environmental bill as a way to think about the polluter-pays principle. If those responsible for more damage paid more of the cost, the revenue could help fund climate and biodiversity action.
According to the researchers, lower estimates for the top decile in both the United States and China could each cover a $675 billion biodiversity financing gap needed by 2030. The central U.S. estimate also surpasses a $993 billion annual climate-action need by 2035 used in the study.
The authors write, “These costs highlight the mitigation responsibility of the top 10%.” That point reaches beyond household purchases, since high-income people can also shape emissions through investments, political influence, professional choices and public visibility.
Environmental taxes aimed at high-consuming groups could also be designed with equity in mind. The study notes that tax revenue can support sustainability transitions while easing burdens on lower-income households.
Policy design would matter. A charge placed broadly on essential goods could hit poorer households hardest. A more targeted approach could focus on luxury consumption, frequent high-emission behavior, or other patterns tied to outsized environmental damage.
The Limits of Pricing Nature
The authors are careful about what their estimate includes. Their bill covers only planetary boundaries for which top-decile footprints and environmental prices were available.
Several major pressures remain outside the calculation. These include novel entities, land-system change, ocean acidification, atmospheric aerosol loading and stratospheric ozone depletion. Including more categories could raise the total bill.
The study also uses consumption footprints from 2017. Those data are the most recent available for this type of footprint analysis, although global consumption patterns have continued to evolve since then.
There is also a deeper limitation. Nature’s value cannot be fully captured by a price. Forests, rivers, species, soils and oceans have cultural, ecological and intrinsic value that stretches far beyond a financial ledger.
Still, the analysis offers a powerful way to see responsibility at the top of the consumption scale. In financial terms, the environmental bill of the world’s richest consumers is large enough to reshape debates about climate finance, biodiversity protection and fairer paths toward sustainability.