

Global Sea Surface Temperature Today
- Data updated
- Source data dated
- Editorially updated
How to read these maps: Temperature shows the estimated nighttime ocean surface in degrees Celsius. Anomaly shows how much warmer or cooler it is than the long-term average for that place and date.
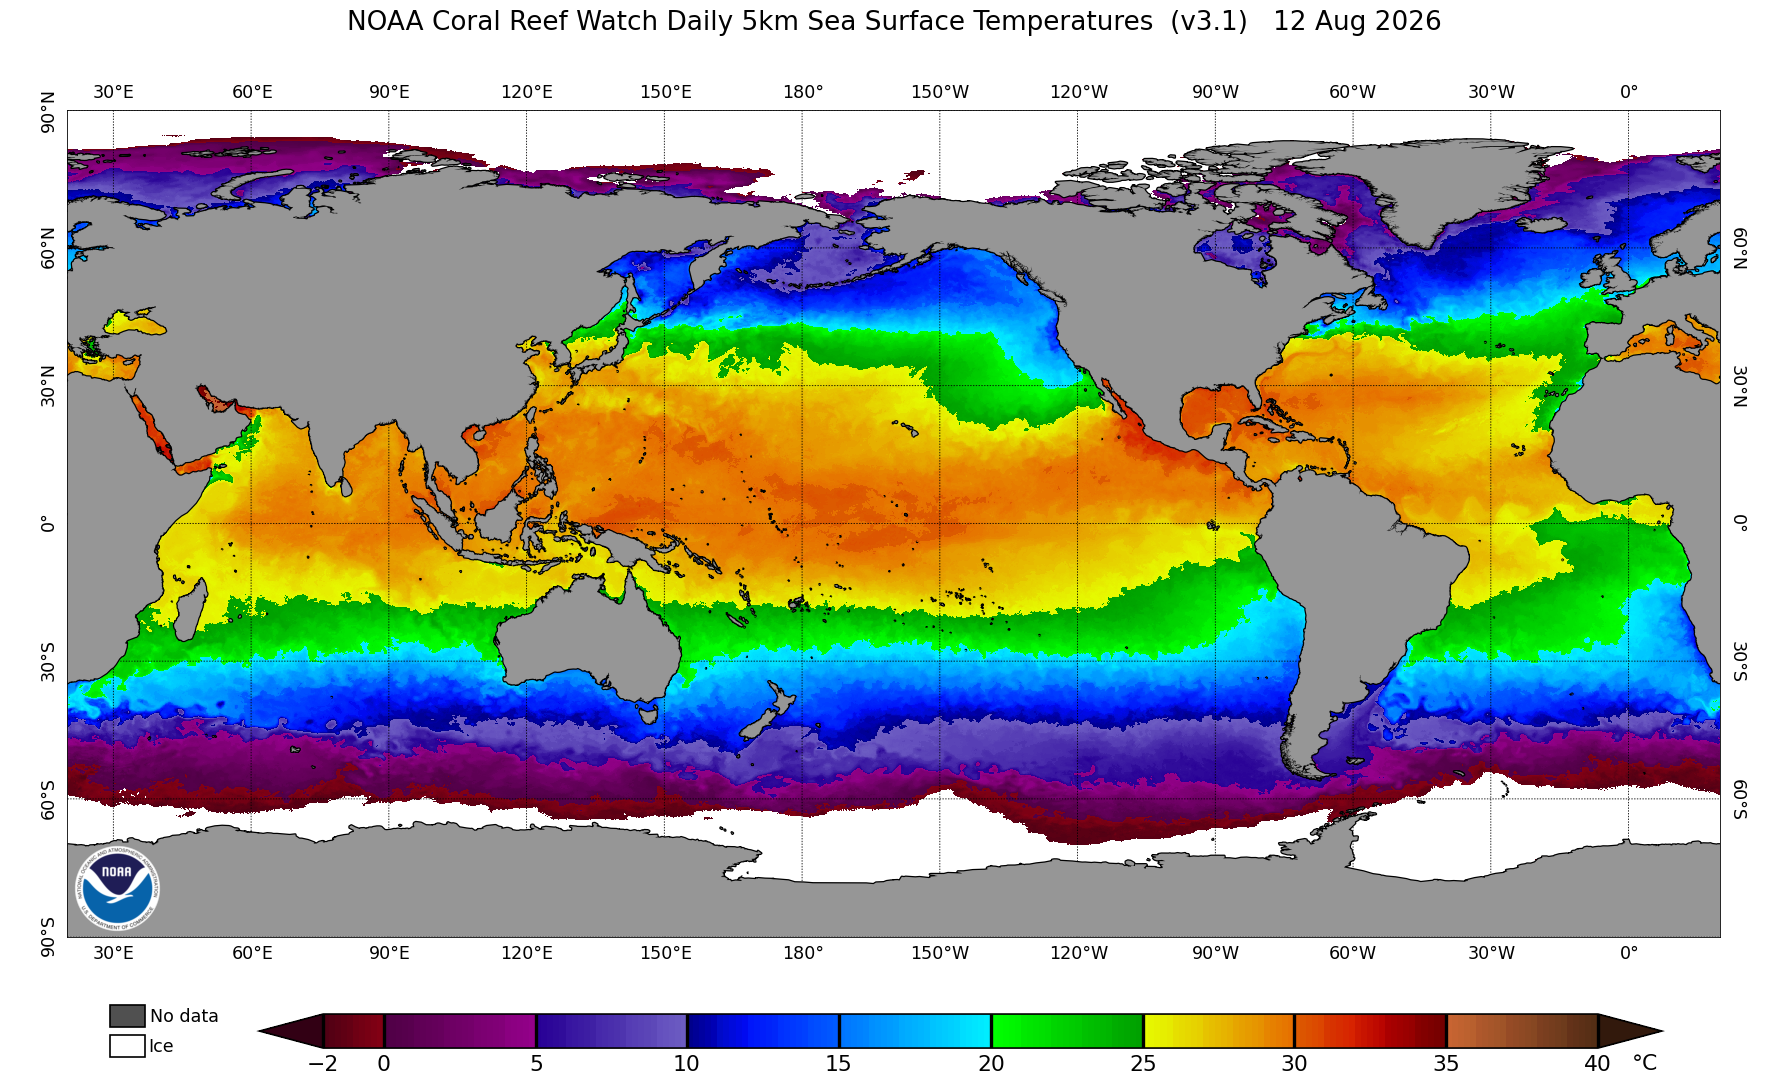
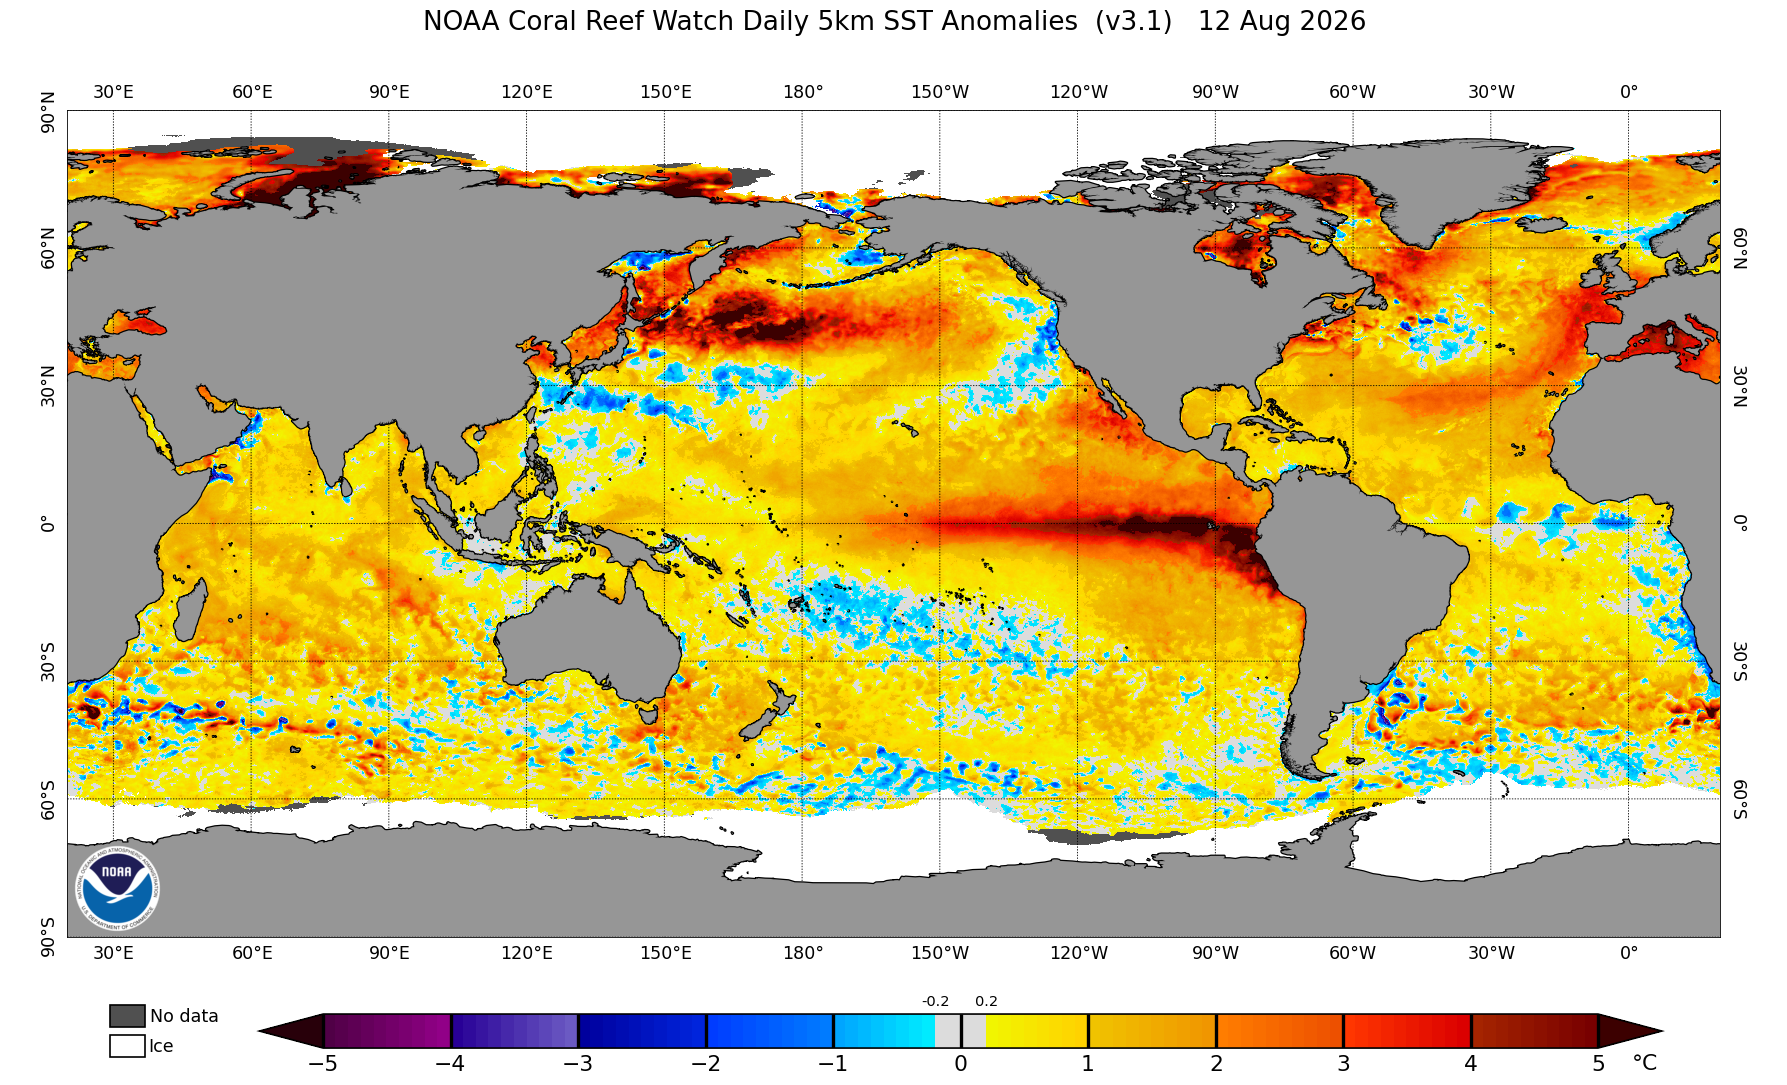
Sea surface temperature influences weather, marine ecosystems, tropical cyclones and the exchange of heat between the ocean and atmosphere. The maps above show NOAA’s latest daily global analysis and the corresponding temperature anomaly. They are refreshed from a server-side copy of the official NOAA Coral Reef Watch product.
What this page shows
The first map is an estimate of nighttime sea surface temperature in degrees Celsius. The second is an anomaly map: today’s temperature minus the long-term average expected for the same place and time of year. A positive anomaly is warmer than the reference average; a negative anomaly is cooler.
Absolute temperature and anomaly answer different questions. Tropical water can be warm in absolute terms while close to its seasonal average. A much cooler high-latitude sea can have a strong positive anomaly if it is unusually warm for that location and date.
How NOAA measures the ocean surface
NOAA Coral Reef Watch’s CoralTemp product combines observations from polar-orbiting and geostationary satellites into a daily global field at approximately 5-kilometre resolution. It is designed to estimate a nighttime “foundation” temperature, reducing some of the short-lived daytime warming that can affect the ocean’s uppermost skin.
Satellite instruments do not lower thermometers into every grid cell. They infer temperature from radiation leaving the surface. Clouds obscure infrared observations, so the analysis blends multiple sensors and uses quality control and interpolation to fill remaining gaps. Buoys and other in-water observations remain important for validation and for understanding conditions below the surface.
How to read the anomaly map
Large connected areas are usually more meaningful than a single isolated pixel. Watch for persistent patterns across several days: broad warm anomalies in an ocean basin, cool water along an upwelling coast, or a band of unusual temperature along the tropical Pacific.
An anomaly is not automatically evidence of a marine heatwave. Operational marine-heatwave definitions also consider thresholds, duration and the local seasonal distribution. Coral bleaching heat stress likewise depends on accumulated exposure, not one warm daily map.
What sea surface temperature does not show
- It does not directly measure the temperature of the full water column or the ocean’s total heat content.
- It does not replace local beach, fisheries, shipping or hurricane guidance.
- It cannot show small nearshore features that are narrower than the analysis grid.
- Clouds, sea ice, aerosols and sensor coverage can affect the inputs and the amount of interpolation required.
- A daily anomaly should not be treated as a climate trend without a longer, consistently processed record.
Methodology and source
The live maps come from the NOAA Coral Reef Watch daily global 5 km sea surface temperature product and its daily anomaly product. NOAA says the products are normally updated each afternoon at about 13:30 U.S. Eastern Time. The source pages explain the sensor inputs, climatology and processing in more detail.
ARGO.net stores a validated copy of each current PNG during its scheduled refresh. The visible source-data time is taken from the official file metadata when NOAA provides it. If a refresh fails, the last verified map remains visible and is marked as delayed.
Update log
- August 2026: Page launched with daily global SST and anomaly maps, source timestamps and reading guidance.





