
The Atlantic Ocean once hid its largest landscape in plain sight. Beneath the waves lay a long mountain chain, deep plains and a valley running along the middle of the ridge. In the early 1950s, Marie Tharp saw the clue in six ship-track profiles. Each showed a V-shaped dip near the center. Together, the marks suggested a vast rift valley beneath the ocean.
That pattern carried high stakes for geology. Many scientists still debated continental drift and the deep seafloor had few reliable maps. Tharp turned scattered measurements into a coherent picture that people could inspect. Her North Atlantic map, published in 1956, made the hidden terrain visible at a scale that invited a new question: what could create such a continuous feature?
A 2026 account from the Library of Congress traces how Tharp’s visual work and the earthquake data assembled by her colleagues strengthened the case that the ridge was real and connected. It gave later researchers a crucial geographic framework for testing ideas about the ocean floor while broader questions about Earth’s crust remained open.
Six profiles reveal a valley
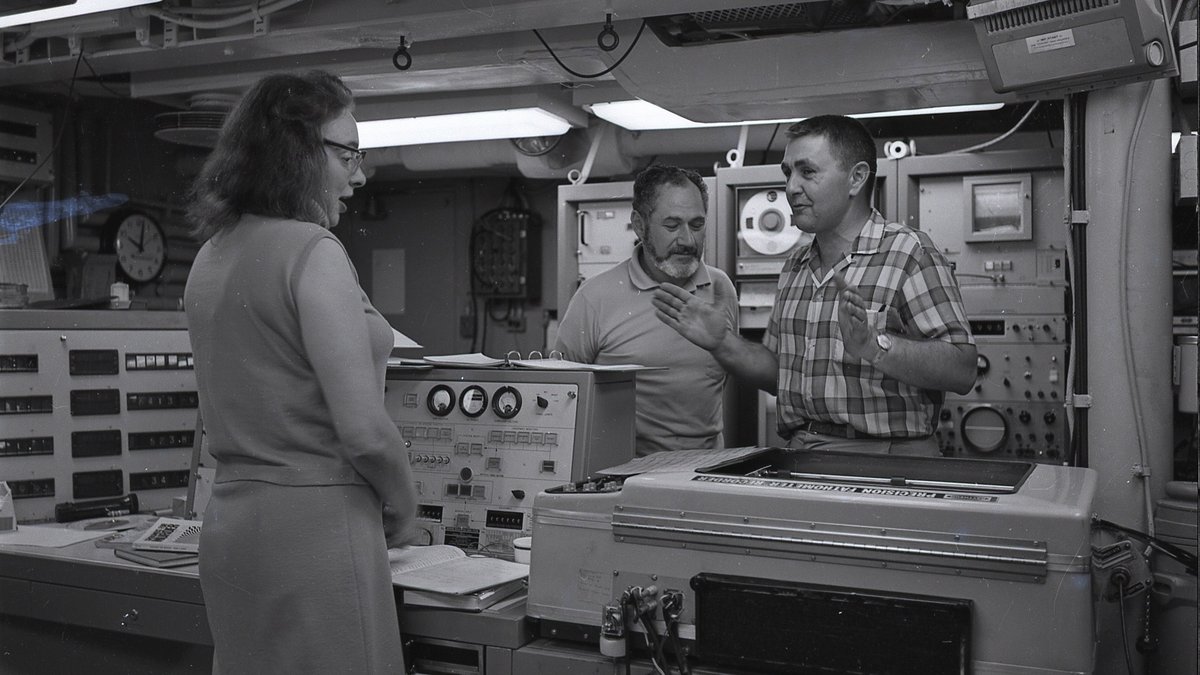
Tharp worked at Lamont Geological Observatory in New York after World War II. Research ships collected depth soundings, measurements based on the time a sound signal took to travel to the seabed and return. Women were barred from the shipboard expeditions that gathered much of this information. Tharp’s desk work became the place where the separate records could be compared carefully.
She began by drawing two-dimensional profiles along the paths sailed by the ships. A profile is much like a side view of a landscape, except its horizontal line follows a route across the ocean and its vertical scale shows water depth. Tharp then made three-dimensional sketches. Her geological training helped her connect the lines across gaps where no ship had passed.
Across the North Atlantic set, the same indentation appeared. Tharp interpreted it as a V-shaped rift valley within the Mid-Atlantic Ridge, a striking break in an underwater mountain system. Her own account, “Mappers of the Deep,” records that the first detailed physiographic diagram of the North Atlantic was finished by 1956. The result required judgment as well as measurement, because every broad feature had to be traced from incomplete lines of evidence.
Every plotted line also carried the limits of its origin. Soundings described conditions directly below a moving ship, leaving broad spaces between tracks. Tharp regarded those blank areas as a challenge for careful interpretation. She looked for shapes that repeated from profile to profile and used them to build a continuous terrain. That disciplined act of comparison turned a collection of route records into a testable picture of the ocean basin.
Earthquakes trace the same route
Tharp’s drawings gained another powerful line of support when Bruce Heezen and Howard Foster mapped Atlantic earthquake epicenters. Heezen was working on a Bell Laboratories project seeking suitable routes for underwater cables. Across the ocean basin, the epicenters lined up with the rift shown on Tharp’s diagrams.
That match mattered because earthquakes can reveal active breaks and movement in Earth’s outer rocky shell. The ridge was no longer simply a shape inferred from soundings. It also marked a zone of seismic activity. The Library of Congress says the pattern persisted as the mapping effort expanded beyond the Atlantic, reinforcing the idea of a globe-spanning ridge system.
Modern geology supplies the mechanism behind that relationship. At a mid-ocean ridge, tectonic plates spread apart and shallow earthquakes occur along the boundary. Molten rock rises beneath the separating plates and cools to form new ocean crust. That process builds a mountain chain on the seafloor. The ridge’s central valley and its seismic pattern therefore became features that could be studied together.
An epicenter marks the point on Earth’s surface above where an earthquake begins. Placing many epicenters on the same map can reveal a pattern that one earthquake cannot show. Heezen and Foster’s Atlantic compilation gave Tharp’s valley a second kind of evidence, one based on the behavior of the planet as well as its shape. That convergence helped scientists judge the feature’s continuity along the ridge.
A 1956 map makes the seafloor legible
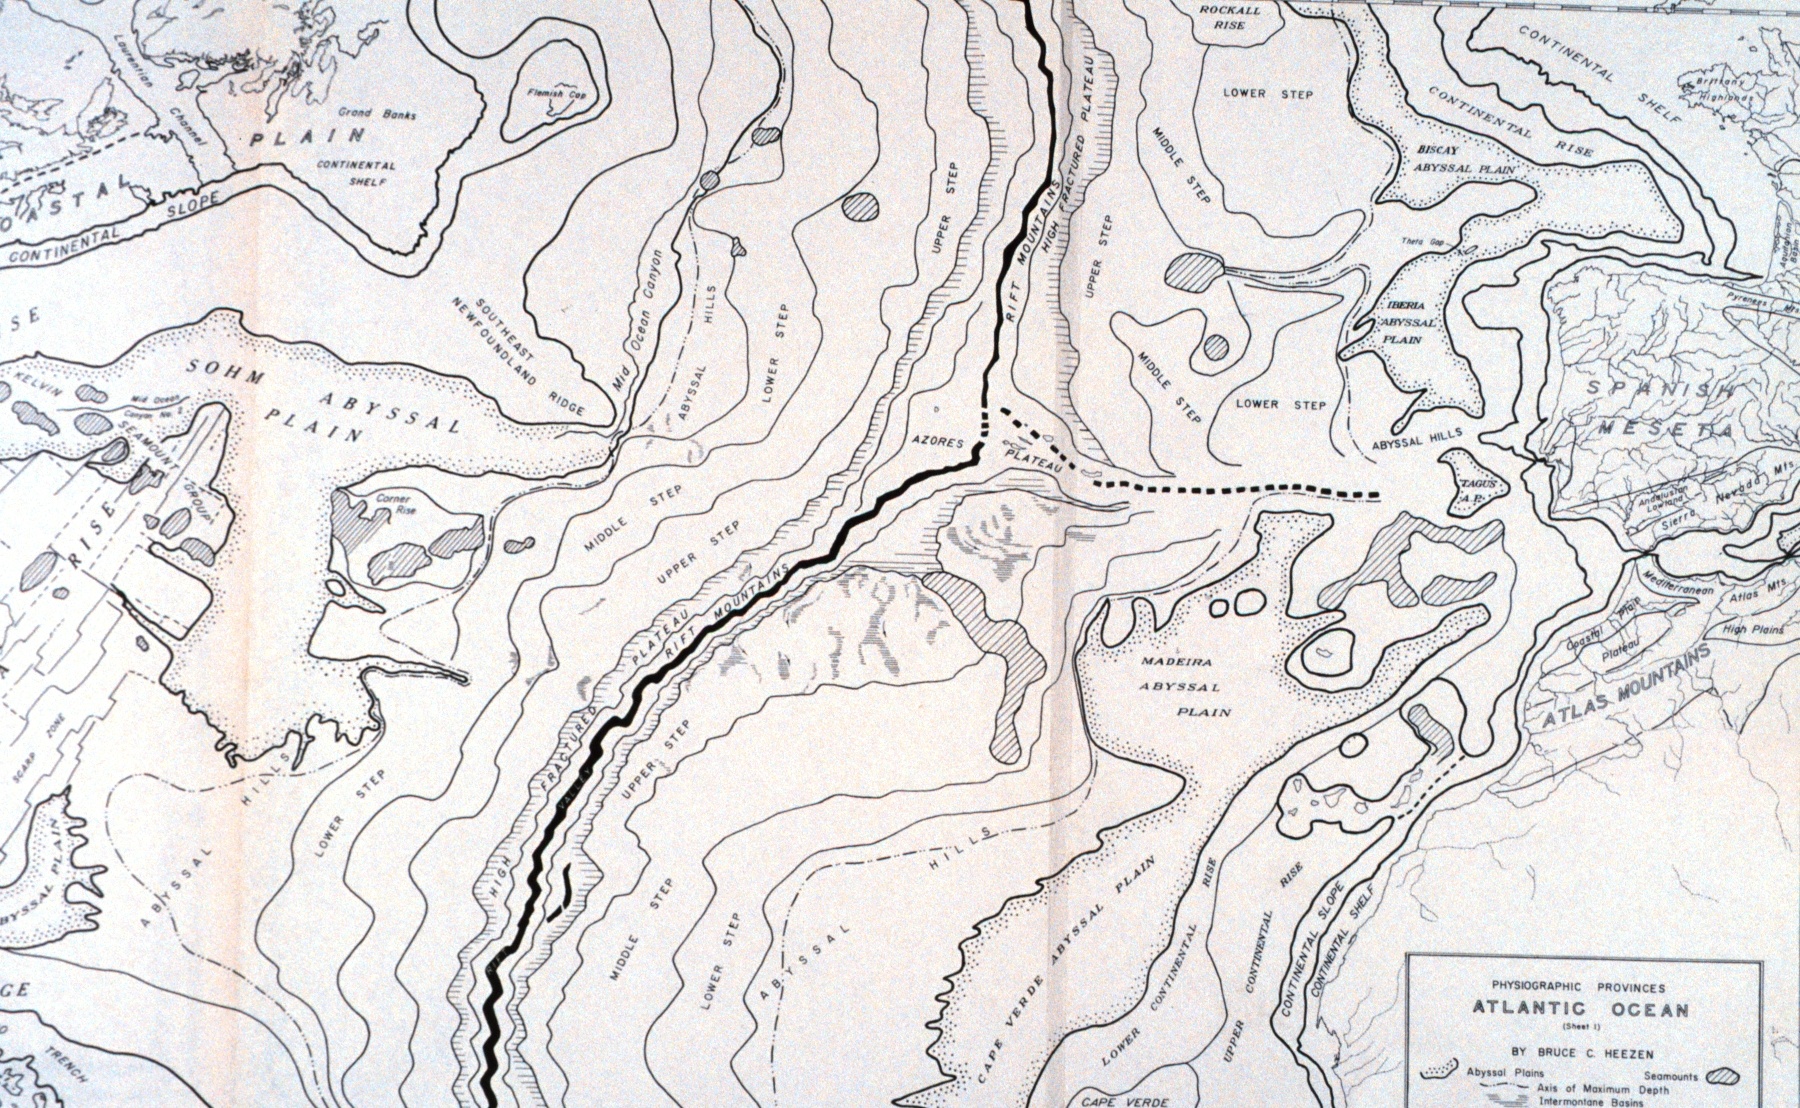
In 1956, Tharp published the pen-and-ink physiographic map of the North Atlantic and the work was presented at the American Geophysical Union meeting. A physiographic map emphasizes landforms, giving readers an intuitive view of mountains, valleys and plains. For a hidden ocean landscape, that shift was profound. It converted a chain of narrow survey tracks into a landscape whose form could be debated and investigated.
The map also showed why cartography can be part of scientific discovery. A table of soundings is valuable, yet a connected drawing can expose a repeated structure that raw numbers conceal. Tharp’s images followed the ships’ paths while reaching beyond them through informed geological interpretation. Scientists could then compare the proposed ridge and valley with earthquake records, rock samples and later surveys.
Today, a USGS model explains that bathymetry, the shape of the seafloor, reflects plate tectonics. Where plates diverge, magma forms fresh crust and produces mid-ocean ridges. Tharp’s map arrived before the full modern explanation took hold. Its value lay in showing a physical pattern that later evidence could connect to seafloor spreading and plate motion.
Maps also change who can take part in a scientific argument. A drawn ridge made the evidence easier to compare across specialties. A seismologist could examine earthquake locations, while a geologist could consider the form of the valley. Later surveys could challenge, refine, or confirm the lines. The 1956 chart therefore worked as a shared reference point, carrying seafloor observations beyond the individual ship logs from which they began.
From a regional chart to a global view
Tharp continued mapping with Heezen for roughly two decades, bringing new data into an expanding view of the world’s oceans. Their work advanced alongside major changes in marine geophysics. Measurements of magnetic stripes, earthquakes and seafloor ages gave scientists several ways to test how crust formed and moved. The maps helped organize those findings spatially.
In 1977, the Heezen-Tharp-Berann world ocean-floor map appeared. Austrian painter Heinrich Berann, known for Alpine panoramas, painted the final map from the team’s bathymetric work. The Library of Congress describes it as the first realistic depiction of complete ocean-floor bathymetry and its Geography and Map Division holds the original manuscript. The image made a global system of ridges, trenches and basins understandable at a glance.
The history is larger than one map or one person. Plate tectonics emerged through evidence from many researchers and methods, including seafloor spreading, paleomagnetism and seismology. Tharp’s contribution was a decisive visual and geological insight: the ocean floor had a connected structure that deserved to be taken seriously. A NOAA overview now describes mid-ocean ridges as places where plates move apart and new seafloor forms. Her painstaking maps helped make that unseen world available for such explanations.
The surviving record preserves the practical work behind the famous images. In 1995, Tharp donated her and Heezen’s research papers to the Library of Congress. The collection includes maps, journals, correspondence and research papers. It also contains cartographic and geological data. Those materials show that the finished charts rested on many acts of calculation, drawing, revision and collaboration. They also let future readers follow how a pattern in profiles became a landmark view of the ocean floor. Careful visual reasoning can combine measurements collected for one purpose with other observations, allowing researchers to see a larger system. Tharp’s work remains a vivid example of how mapping can open a path toward major scientific change.





