
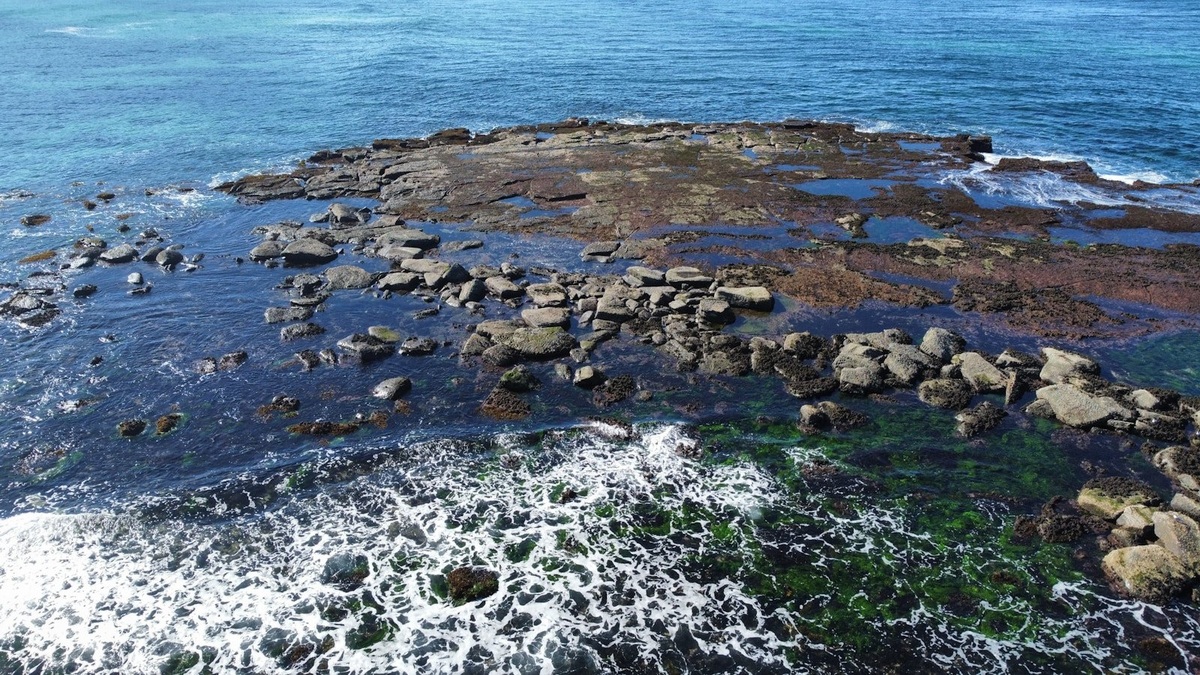
Most coastlines experience two high tides and two low tides during a lunar day, which lasts about 24 hours and 50 minutes. The usual interval from one high tide to the next is therefore close to 12 hours and 25 minutes. Local coastlines complicate that simple pattern, leaving some places with one daily high and others with two highs of noticeably different size.
Oceanographers group these cycles into three broad families: semidiurnal, mixed and diurnal. NOAA’s explanation of daily high tides emphasizes that continents, seafloor topography and the changing alignment of Earth, Moon and Sun modify the ideal response. A tide table for the specific harbor gives a more useful answer than a universal clock.
Why most places get two high tides
The Moon’s gravity is stronger on the side of Earth facing it and weaker on the far side. The difference stretches the ocean into two broad tidal bulges, one generally facing the Moon and another on the opposite side. As Earth rotates through them, a coastline can pass through two highs. The Sun creates its own, smaller tidal force and changes the combined pattern through the month.
A lunar day runs about 50 minutes longer than a solar day because the Moon moves eastward in its orbit while Earth turns. A location must rotate a little farther to face the Moon again. As a result, tide times commonly shift later from one day to the next instead of repeating at the same hour.
The National Ocean Service’s lunar-day tutorial illustrates the two-bulge model. It is a useful starting point, although real oceans are broken into basins and bounded by continents. Tidal waves must travel around land and across seafloor features, producing local schedules far more intricate than the global sketch.
Semidiurnal, mixed and diurnal patterns
A semidiurnal tide has two highs of roughly similar height and two comparable lows during one lunar day. Much of the Atlantic coast of North America follows this pattern. The familiar rhythm gives about six hours between a high and the next low, followed by another six hours to the next high.
A mixed tide still has two highs and two lows, but their heights differ substantially. Mixed patterns are common along the Pacific coast of North America. A chart may label the daily extremes as higher high water, lower high water, lower low water and higher low water. These distinctions matter for navigation and coastal design because the greater high or lower low can set the limiting condition.
A diurnal tide produces one high and one low per lunar day. Parts of the Gulf of Mexico show this pattern. The basin’s natural response suppresses or combines some tidal components, allowing a once-daily constituent to dominate. Geography therefore changes the count that a shoreline observer sees.
The NOAA Tide Predictions service presents curves and tables for individual U.S. stations. Comparing Boston, San Francisco and Gulf Coast stations quickly reveals all three families. Their differences come from wave propagation through each ocean basin rather than a change in the Moon’s basic pull.
Why the two highs are often unequal
The Moon’s orbit is tilted relative to Earth’s equator. When the Moon lies north or south of the equator, one daily bulge may favor a location more than the other. Oceanographers call the resulting inequality diurnal inequality. Its strength changes as the Moon’s declination shifts during the month.
Coastal geometry adds another layer. A tidal wave bends around capes, reflects from boundaries and loses energy to friction in shallow water. Narrow bays can amplify certain frequencies, while broad shelves delay them. The local tide is the sum of several constituents, each linked to an astronomical cycle and each altered by the basin through which it travels.
Harmonic analysis separates a long water-level record into those constituents. Once their amplitudes and phases are known, scientists can calculate future astronomical tides with high precision. The NOAA harmonic constituents guide describes how station-specific constants support predictions.
Weather creates departures from the predicted curve. Wind can pile water against a coast and low pressure raises the surface slightly. River flow and waves may add local effects. A forecast high tide describes the astronomical level; the observed water may stand higher or lower when a storm arrives.
One place can even display different apparent patterns during the month. When twice-daily constituents weaken relative to once-daily ones, one high may become small enough to be difficult to distinguish. Tide classifications summarize the dominant behavior, while the daily prediction shows the actual sequence.
High tide, higher high water and flooding
At a mixed-tide station, the phrase “high tide” leaves an important ambiguity. Mean Higher High Water, abbreviated MHHW, is the average height of the higher high tide in each tidal day over an official 19-year tidal epoch. Surveyors and coastal planners use this stable statistical surface as a reference.
NOAA’s tidal datum information distinguishes MHHW from mean high water, which averages all high waters. A harbor entrance may remain safe at one high and still be too shallow at the smaller high. Wetland boundaries and building standards can also depend on a precisely defined datum.
High-tide flooding occurs when the total water level exceeds a local threshold, sometimes on otherwise calm days. A predicted high combines with seasonal water levels and shorter-term weather effects. As relative sea level rises, the same astronomical cycle can cross the flooding threshold more often. NOAA’s sea-level rise technical report tracks how this risk is changing around U.S. coasts.
For anyone planning a beach walk, boat launch or fishing trip, the practical method is straightforward. Select the nearest suitable station, check both heights and times, then allow for weather. Most coasts get two high tides, but the local table tells whether the day brings a semidiurnal pair, unequal mixed highs or a single diurnal peak.
Spring and neap tides change height, not the basic count
Near new and full Moon, the solar and lunar tidal forces reinforce each other, producing spring tides with a larger range. Near the quarter Moons, their partial opposition produces smaller neap ranges. The names describe amplitude and have no connection to the season of spring.
A semidiurnal coast usually retains two daily highs through both phases. Their heights expand and contract over roughly two weeks. Local interactions among constituents can make one peak hard to recognize, especially in a mixed or diurnal region, but the spring-neap cycle does not by itself switch every coast between one and two tides.
The Sun also contributes annual and semiannual variations, while the Moon’s distance changes its influence. Tide-prediction software sums these periodic components using constants derived from observations. The resulting curve shows both timing and height, avoiding the false expectation that every high tide during a full Moon must be extreme.
Prediction tables normally list times in a stated time zone and heights relative to a named datum. Daylight-saving changes can shift the clock display without changing the physical tide. Users should also distinguish the nearest subordinate station from a reference station, because a few miles of coastline can introduce a meaningful time correction.
A complete answer to “how many” therefore contains both a general rule and a location. Two daily highs describe most coasts, one describes diurnal regions and unequal high tides characterize mixed regimes. The station prediction resolves the remaining details, including the 50-minute daily drift and the changing range through the lunar month. Local observations remain essential.
Related reading: spring tides and neap tides and ebb, flood and slack water.





