NASA’s Terra satellite captured Tropical Storm Arthur over the U.S. Gulf Coast on June 17, 2026, shortly after the official advisory from the National Hurricane Center identified the system as a tropical storm. The images show a broad swirl of white clouds spreading across Gulf waters and reaching inland over Texas and Louisiana.
The storm became the first named storm of the 2026 Atlantic hurricane season. It stayed below hurricane strength, yet its size and moisture made it a serious rainmaker for parts of the central Gulf Coast.
NASA Earth Observatory released the views using data from Terra’s Moderate Resolution Imaging Spectroradiometer, also known as MODIS. One image shows the storm in natural color. A second image uses infrared information to reveal the coldest cloud tops, which often mark the storm’s most active cloud towers.
Arthur Forms Over the Gulf Coast
Tropical Storm Arthur developed near the Texas coast during the middle of June, just weeks after the official start of the Atlantic hurricane season. Around the time Terra passed overhead, the storm had recently earned its name from the National Hurricane Center.
Arthur’s maximum sustained winds were near 40 miles per hour, or 65 kilometers per hour, when the satellite images were acquired. That placed the system at the low end of tropical storm strength. Even so, the wind field stretched far from the center.
The National Hurricane Center reported that “Tropical-storm-force winds extend outward up to 175 miles from the center.” That broad reach helped explain why a modest storm on the wind scale could affect such a wide area of the Gulf Coast.
Galveston, Texas, recorded a wind gust of 48 miles per hour as Arthur moved nearby. The storm also pushed bands of rain inland, where saturated air fed heavy downpours over coastal communities and low-lying areas.
What Terra Saw From Orbit
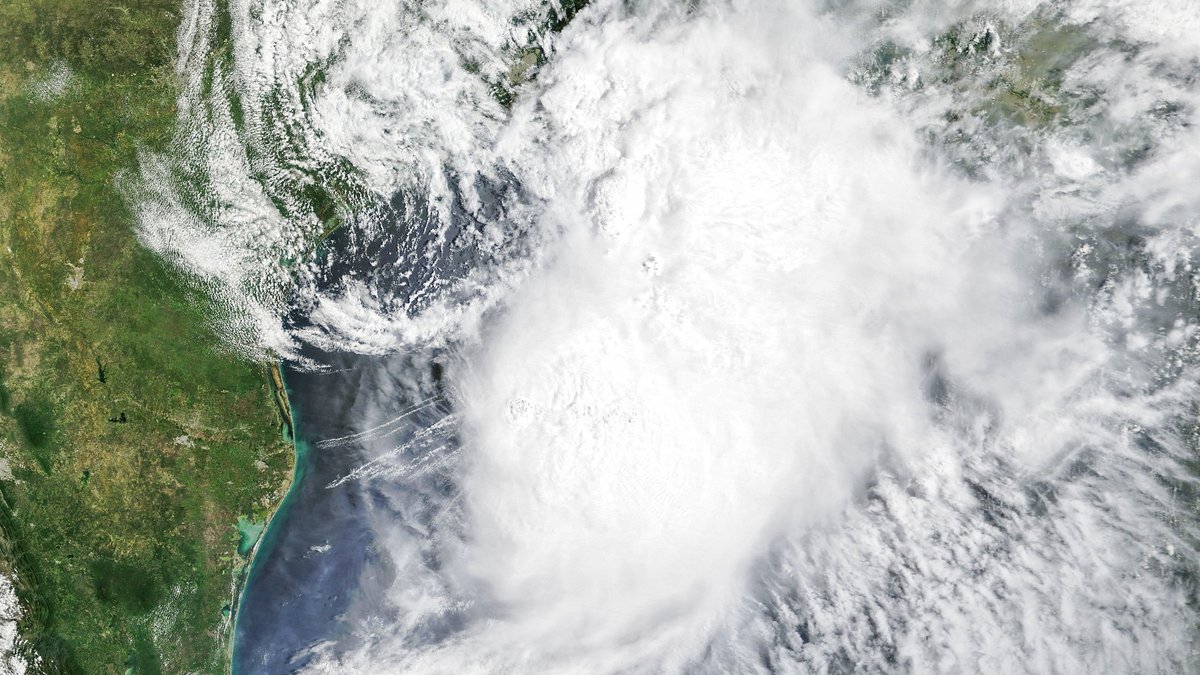
From orbit, Terra saw Arthur as a broad cloud shield spread over the warm waters off the Gulf Coast. The natural-color view captured at 10:30 a.m. Central Time, or 15:30 Universal Time, showed bright white storm clouds curling near the coast.
Some cloud bands reached inland over parts of Texas and Louisiana. That structure matched the storm’s main hazard. Arthur was carrying deep tropical moisture into a region where rain could fall quickly enough to overwhelm drainage systems.
The natural-color image gives a view that feels familiar to the eye. White clouds stand out against darker ocean water and land surfaces. This kind of image helps show the storm’s shape, its cloud coverage and its connection to nearby coastal areas.
Terra’s MODIS instrument has long been used to observe clouds, smoke, dust, vegetation, sea ice and other features across Earth. For storms like Arthur, it can show how organized the system looks at the time of an overpass.
Why Cold Cloud Tops Matter
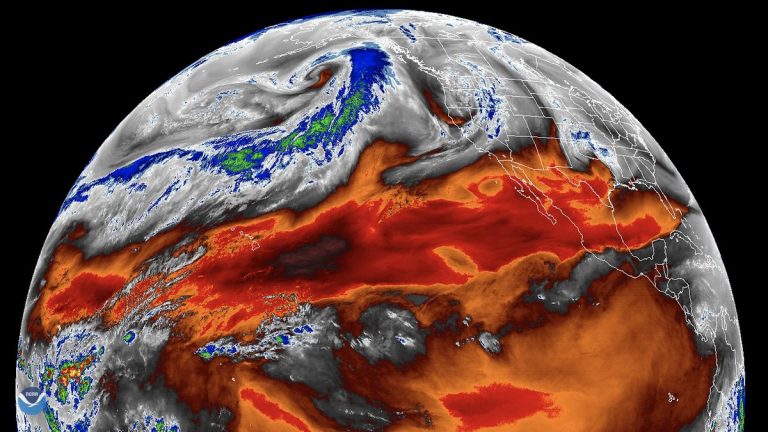
The second NASA image uses brightness temperature, an infrared signal that helps scientists separate cold cloud tops from warmer surfaces below. In the Arthur image, white and purple areas mark cooler cloud tops, while yellow and orange areas show warmer land and ocean surfaces.
Cold cloud tops can point to tall, vigorous clouds. In tropical systems, these clouds form when warm, moist air rises rapidly. As that air climbs, water vapor condenses, releases heat and builds towering cloud structures.
That rising motion is a central part of tropical storm behavior. Stronger bursts of rising air can support heavier rain and more active thunderstorms within the storm’s rain bands. Infrared imagery helps reveal those active zones, especially when visible light alone gives a less complete picture.
Brightness temperature also helps forecasters and scientists track changes in a storm’s structure. A cluster of colder cloud tops can signal intense convection. Warmer cloud-top patterns can indicate areas where clouds are lower or where the storm is becoming less organized.
For Arthur, the infrared view showed cooler cloud tops over Gulf waters and nearby coastal areas. That pattern matched the heavy rainfall risk unfolding along parts of the central Gulf Coast.
Heavy Rain Becomes the Main Threat
Arthur’s winds drew attention when it received its name, yet rainfall quickly became the dominant concern. The National Weather Service warned that heavy rain from the storm could cause life-threatening flash flooding.
NASA’s rainfall estimates added another view of the threat. IMERG, the Integrated Multi-Satellite Retrievals for GPM, showed high rainfall rates over Gulf waters and extending inland on June 17. IMERG combines observations from multiple satellites to estimate precipitation across the globe.
The product is part of the Global Precipitation Measurement mission, a collaboration led by NASA and the Japan Aerospace Exploration Agency. For storms like Arthur, such satellite-based estimates are useful because heavy rain can fall over water and remote areas where ground-based measurements are limited.
On June 18, Arthur’s moisture continued to feed intense rainfall over central Gulf Coast states. The National Weather Service reported rainfall rates of 3 inches per hour in southeastern Louisiana. At that pace, roads can flood rapidly, especially in urban areas and places with poor drainage.
Forecasts indicated that storm-total rainfall amounts could exceed 12 inches in some areas. Some locations were expected to approach 20 inches. Those totals can produce dangerous flooding even after a tropical storm’s winds begin to fade.
Arthur Weakens, Moisture Lingers
Arthur tracked northeast as it moved along the Gulf Coast. The National Hurricane Center said, “Arthur is moving toward the northeast near 9 mph.” That slow movement helped keep moisture aimed at the same general region for an extended period.
As the storm weakened, its cloud pattern became less organized. Tropical systems often lose structure when they interact with land or encounter less favorable atmospheric conditions. The rain shield can remain large after the circulation weakens.
That lingering moisture is one reason weak tropical storms can still leave major impacts. Rain bands can train over the same area, which means repeated downpours pass over communities in succession. Streams, bayous and storm drains can rise quickly under that pattern.
NASA’s paired images of Arthur show the value of viewing a storm in more than one way. Natural color reveals the storm’s broad cloud cover. Infrared brightness temperature highlights colder cloud tops tied to active clouds and heavier rainfall potential.
For residents along the Gulf Coast, Arthur was an early-season reminder that a storm’s category tells only part of the story. Satellite data helped reveal the larger footprint of wind, clouds and rain as the first named Atlantic storm of 2026 spread inland.